Tempe Real Estate Market Reports:
Tempe, Arizona Home Sales Prices: |
Click image below to enlarge!
2023
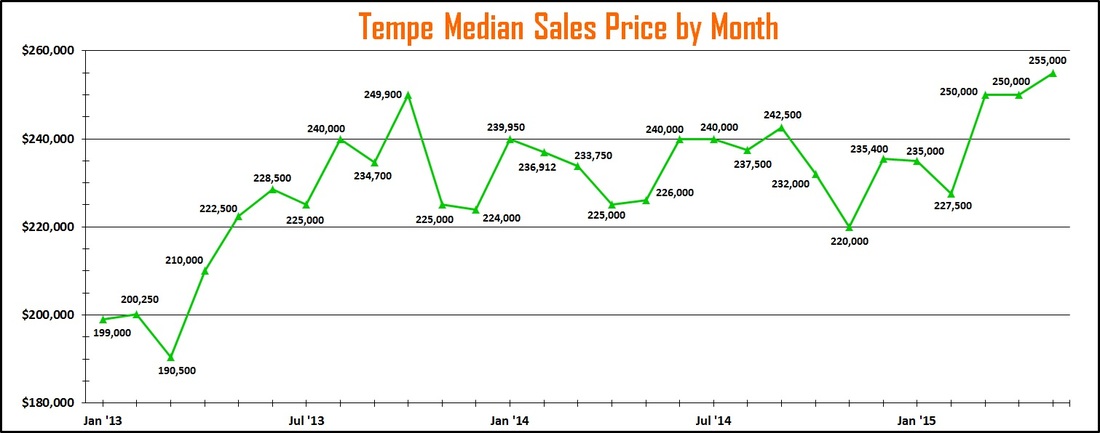
The median sales price of Tempe homes decreased in January to start of 2023 but had been on an increasing trend through May. June saw a decline and July remained the same as June.
2022
Tempe median sales prices increased to a new all-time high to start off 2022. The median sales price in Tempe continues to increase through May. Since then, median sales prices in Tempe have alternated between increasing and decreasing each month through September, with an overall trend downward. October and November both saw decreases in the Tempe median sales price while December remained the same as November. The median sales price in Tempe is now -2.6% lower than they were in December of last year.
2021
The median sales price in Tempe shot up in January to an all-time high, starting 2021 on a high note. As inventory remains incredibly low, and buyer demand remains very strong, home prices in Tempe are expected to continue to increase but may not increase as much as they did in 2020. It's difficult to know how long this frenzied demand for homes can continue, but as long as there is a lack of homes for sale, prices will increase. Tempe median sales prices have increased for seven straight months, leading to a new all-time high of $477,500 in June. For the first time in 8 months, the median sales price in Tempe decreased slightly to $475,000 in July, but increased again in August and September, reaching a new all-time high of $488,250. The median sales price in Tempe decreased in October and November but increased in December to end the year slightly below the all-time high from September. The median sales price in Tempe is now 23.3% higher than they were in December of last year.
2020
The median home price in Tempe started higher in January ($345,000) than it was the previous month (December). There was a slight dip in February, and then prices shot up in March, just as the Coronavirus hit the US Housing market and shut down our economy in the middle of the month. We will have to see if home prices can withstand the economic shutdown long-term, as over 40 million people have lost their jobs, and many businesses have been closed by the government due to the pandemic. Home prices decreased in April and May but are still higher than any previous year since before 2013. June saw the median sales price of Tempe homes increase to $384,000. The median sales price in July and August consecutively dropped back down to $368k, but increased in September and October, shooting back up to an all-time high of $403,500. November saw a slight drop in the Tempe sales price, while December ended with a slight increase in the median sales price. Overall, Tempe median sales price saw an increase of 14.5% in 2020, even though the final median price in December was slightly less than the high of $403,500 in October.
2019
The median home price in Tempe started off high in 2019, and continued an overall growth throughout the year, reaching a high median sales price of $357,000 in November.
Tempe, Arizona Home Sales:
Click image below to enlarge!
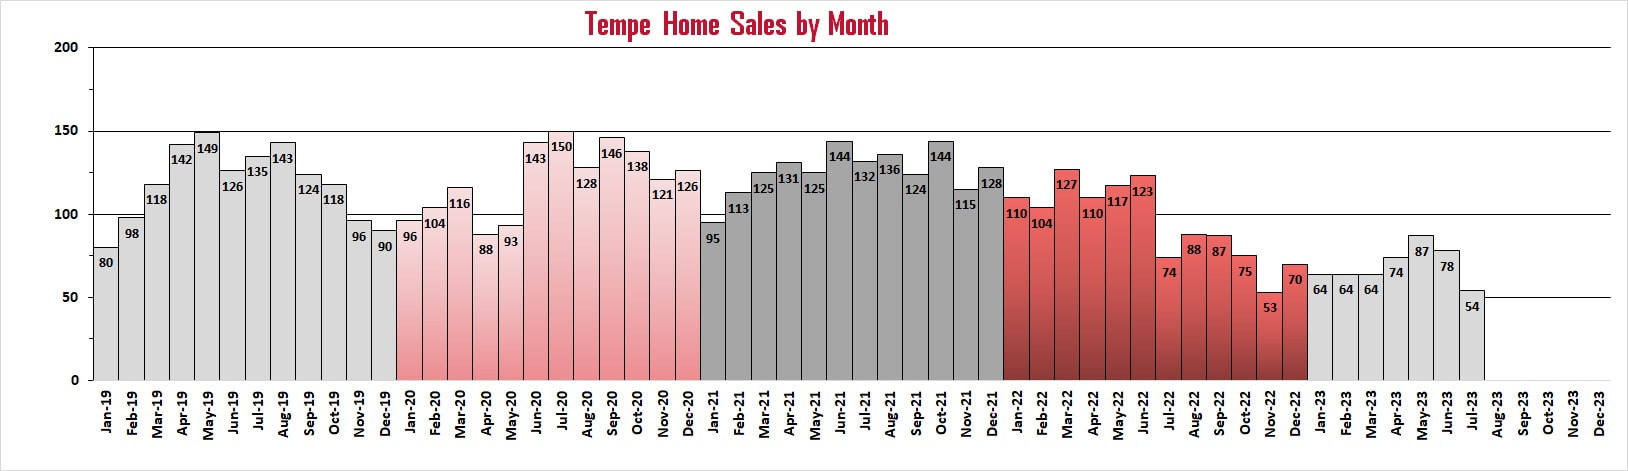
2023
After increasing in December, January home sales dropped to start 2023. They have remained about the same through March, with increases in April and May and decreases now in the last two months.
2022
Tempe home sales by month decreased in January to start off 2022. This is the second January in a row where Tempe home sales declined to start a new year, however, home sales in January of 2022 are higher than they have been in January of the last three years. Tempe home sales dropped in February, but increased to 127 in March, higher than in the last three years. April saw another decline in home sales, falling below 2019 and 2021 levels. May and June have seen small increases, and July saw a significant drop in Tempe home sales. August saw another increase in Tempe home sales while September saw a very slight decrease. October and November continue to decrease as we head into the winter months, but December increased to end the year.
2021
Tempe homes sales by month started off 2021 almost exactly where it started in 2020. Although home sales really picked up the last four months of 2020, the continued lack of inventory has slowed the number of homes sold in Tempe. February saw a nice increase in the number of homes sold, higher than the previous two years. March and April continue to see Tempe home sales increase, but at a slower pace. May saw a decrease in the number of Tempe homes sold, which is not normally the case. In previous years May has had the highest number of Tempe home sales. Obviously, the shortage of homes for sale has something to do with the low number of sales. Tempe home sales in June saw a nice increase to 144. Tempe home sales dropped to 132 in July, but increased a little in August, back up to 136. Only August of 2019 had a higher number of home sales for that month over the last four years. September home sales dropped a little more but is right online with the numbers from 2018 and 2019. October saw a nice increase in home sales, while November saw another large decrease in home sales (with both months still being higher than in 2018 and 2019). December ended the year with a nice increase in Tempe home sales, reaching a level higher than the previous three years.
2020
The number of homes sold in Tempe started off the highest it has been in the last 2 years in January but didn't increase much in February. By the middle of March, the Coronavirus hit the US Housing market and shut down our economy. We will have to see if home sales can withstand the economic shutdown long-term, as over 40 million people have lost their jobs, and many businesses have been closed by the government due to the pandemic. Home sales did increase a little in March but saw a fairly significant drop-off in April. May was about the same as April, with a small increase of 4 home sales. June and July saw a nice recovery of home sales, up to 149 (the highest so far in 2020), and higher than in July of 2019. August saw a decrease in home sales, but September bounced back up to 146. October saw a slight drop back down, and November decreased a little more. December saw another bump up in the number of Tempe home sales and ended much higher than the previous 3 years for this time of year.
2019
The number of home sales in Tempe started off even lower in January of this year than the previous two years. It gradually increased through May, but only reaching a high of 149 homes sold. From August through the rest of the year, the number of homes sold in Tempe slowed down each month.
Tempe, AZ Home Inventory:
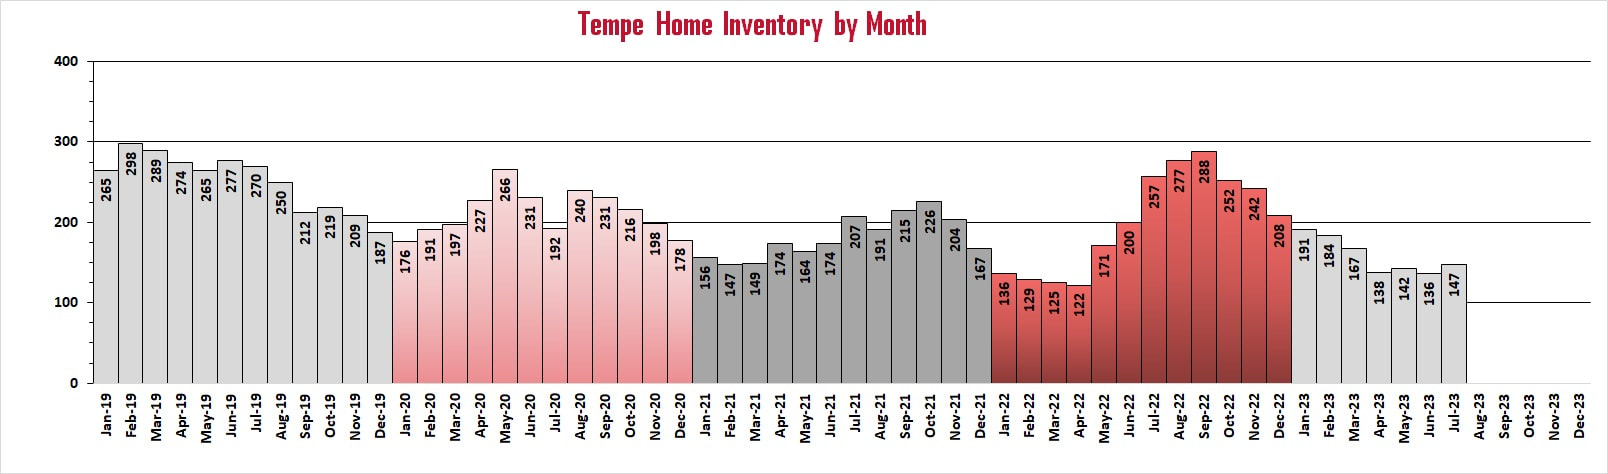
2023
After dropping for seven straight months the inventory of Tempe homes has fluctuated up and down since May while remaining low overall compared to previous years.
2022
Tempe home inventory decreased in January to start off 2022. Home inventory in Tempe continued to decrease for six straight months going from 226 in October of 2021 to 122 in April. This is the lowest inventory of Tempe homes for sale since I have been tracking this data back to 2018. May saw a significant increase in Tempe home inventory after reaching an all-time low and is now higher than in 2021. Tempe home inventory increased for five straight months through September. October finally saw another decrease in Tempe home inventory, followed by another decrease in November and December as we head into the slowest part of the housing season.
2021
The home inventory in Tempe remains low and started 2021 lower than in 2020. With demand so high, hopefully more homes will be listed for sale this year. February continued to see a decrease in the number of Tempe homes for sale, with March slightly increasing. April saw a nice increase in Tempe inventory, with May decreasing again. June inventory increased, as did July, reaching a new 2021 high of 206. August saw a decline in inventory, while September and October both saw increases, to a new all-time high of 222. However, November and December both saw declines in home inventory to end the year.
2017-20
The 2018 inventory of homes for sale in Tempe gradually increased until reaching an all-time high of 314 in September. October and November remained over 300, and then the inventory saw a decline in December to 271. January of 2019 Tempe inventory declined again, before seeing a large increase in February. There was a declining trend throughout the rest of 2019, before reaching a low of 187 in December. January of 2020 continued the decline in Tempe inventory, and then COVID-19 hit. Inventory started to climb in February through May, as the real estate market shut down. As the housing market started opening up again, Tempe inventory dropped in June and July. Then a second Covid-19 wave hit, and inventory shot up again in August. As things settled down, and the housing market opened up again, the inventory of Tempe homes decreased throughout the remainder of 2020.
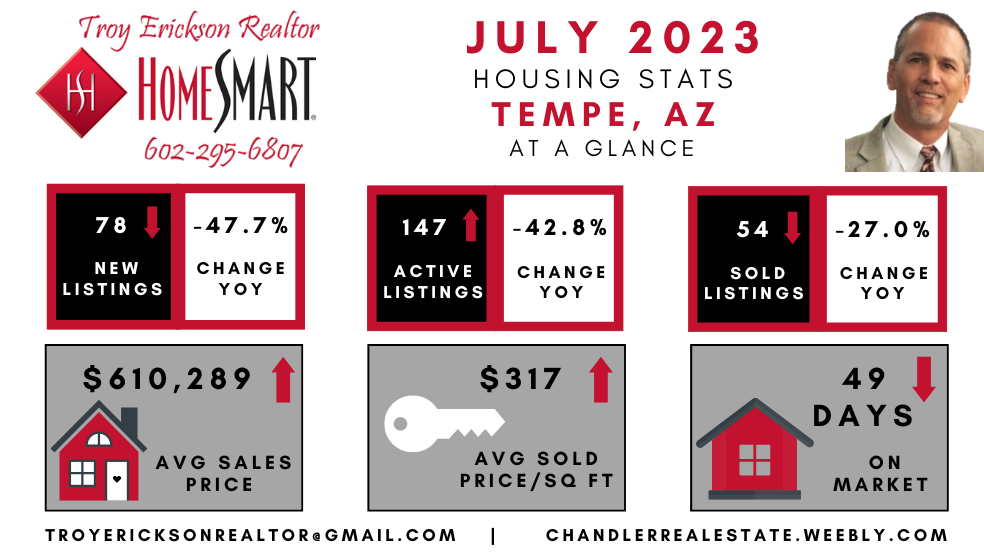
With the average number of Tempe homes sold in the last 6 months decreasing from 72 to 70, and the inventory of homes increasing from 136 to 147, this gives us a slightly increasing absorption rate of 2.1. This absorption rate is still low, as any absorption rate below 6.0 is considered a sellers' market.
After dropping for seven straight months the inventory of Tempe homes has fluctuated up and down since May while remaining low overall compared to previous years.
2022
Tempe home inventory decreased in January to start off 2022. Home inventory in Tempe continued to decrease for six straight months going from 226 in October of 2021 to 122 in April. This is the lowest inventory of Tempe homes for sale since I have been tracking this data back to 2018. May saw a significant increase in Tempe home inventory after reaching an all-time low and is now higher than in 2021. Tempe home inventory increased for five straight months through September. October finally saw another decrease in Tempe home inventory, followed by another decrease in November and December as we head into the slowest part of the housing season.
2021
The home inventory in Tempe remains low and started 2021 lower than in 2020. With demand so high, hopefully more homes will be listed for sale this year. February continued to see a decrease in the number of Tempe homes for sale, with March slightly increasing. April saw a nice increase in Tempe inventory, with May decreasing again. June inventory increased, as did July, reaching a new 2021 high of 206. August saw a decline in inventory, while September and October both saw increases, to a new all-time high of 222. However, November and December both saw declines in home inventory to end the year.
2017-20
The 2018 inventory of homes for sale in Tempe gradually increased until reaching an all-time high of 314 in September. October and November remained over 300, and then the inventory saw a decline in December to 271. January of 2019 Tempe inventory declined again, before seeing a large increase in February. There was a declining trend throughout the rest of 2019, before reaching a low of 187 in December. January of 2020 continued the decline in Tempe inventory, and then COVID-19 hit. Inventory started to climb in February through May, as the real estate market shut down. As the housing market started opening up again, Tempe inventory dropped in June and July. Then a second Covid-19 wave hit, and inventory shot up again in August. As things settled down, and the housing market opened up again, the inventory of Tempe homes decreased throughout the remainder of 2020.
With the average number of Tempe homes sold in the last 6 months decreasing from 72 to 70, and the inventory of homes increasing from 136 to 147, this gives us a slightly increasing absorption rate of 2.1. This absorption rate is still low, as any absorption rate below 6.0 is considered a sellers' market.
How inventory affects home prices:
When the inventory of homes in Tempe increases, the economics of supply and demand will take effect. When there is a large inventory of homes available for sale in Tempe, home prices will decrease in value for a couple of reasons. One reason is because there are more homes for Tempe home buyers to choose from. Buyers will take their time in selecting a home, causing homes to stay on the market longer and increasing inventory. Because there are more Tempe homes for sale, home sellers will begin to lower their sales price in order to get their home sold.
When the inventory of homes in Tempe decreases, you will start to see an increase in home prices. With a low inventory of homes, Tempe home sellers know that they can ask a higher price because there are more buyers in the market than homes for sale. Homes tend to sell faster, and for more money when inventory is low. There are fewer choices for Tempe home buyers, and sometimes you will have to offer a higher than list price to get the home you want.
When the inventory of homes in Tempe decreases, you will start to see an increase in home prices. With a low inventory of homes, Tempe home sellers know that they can ask a higher price because there are more buyers in the market than homes for sale. Homes tend to sell faster, and for more money when inventory is low. There are fewer choices for Tempe home buyers, and sometimes you will have to offer a higher than list price to get the home you want.
Tempe Days On Market:
Click image below to enlarge!
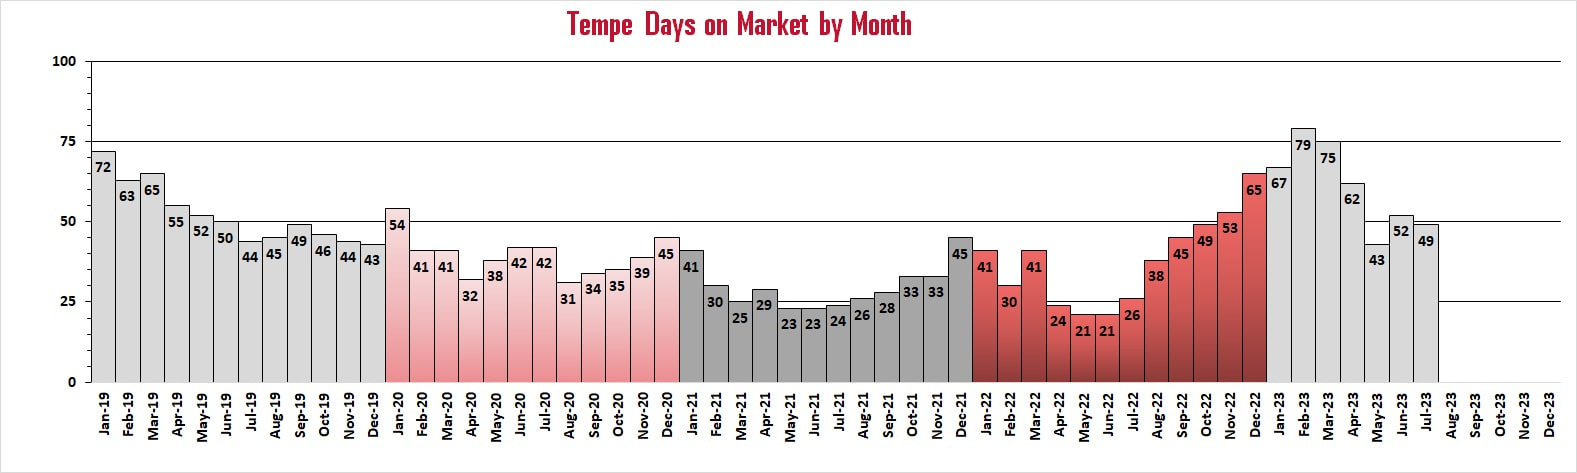
2023
The days on market in Tempe increased for 8 straight months until it finally saw a decrease in March. It continued to decrease through May and has fluctuated up and down the last two months.
2022
After seeing a large increase in the Tempe days on market for December to end 2021, the Tempe days on market saw a decline down to 41 DOM in January of 2022. Tempe DOM shot down in February, but then shot back up to 40 DOM in March. Days on market declined in April and May, and June remained the same as in May, at 20 DOM, an all-time low. July saw an increase in DOM back up to 25, and the DOM has continued to increase for the last six months back up to 65 DOM in December.
2021
After increasing for four months in a row, the days on market to sell a home in Tempe dropped in January to 41 to start the new year. This is the lowest DOM for January in the last 4 years and is due to continued high demand and the low inventory of homes for sale. The days on market dropped to a new all-time low of 25 in March, as competition for homes remains extreme. April saw an increase in DOM for the first time this year but May saw another drop in DOM to another all-time low, this time down to 22 DOM. June DOM for Tempe home sales remained at the all-time low of 22. July, August, September, and October all saw slight increases up to 32 DOM. November remained the same at 32 DOM, and overall is still very low. December saw a huge jump in DOM up to 50 to end the year. This is the highest Tempe days on market has been since January of 2020.
2017-20
As you can see by the graph, Tempe Days on Market has had a very U-shaped curve each year, which shows the DOM has been higher at the beginning of each year, decreasing through the spring and summer months, and then increasing again at the end of each year. The average DOM in Tempe, however, decreased from an average of 58 to 50 between 2017 and 2018, and then increased in 2019 to an average of 53. In 2020, the Tempe DOM started off lower than it ever has in January, at 54. With Coronavirus hitting the US Housing market in mid-March and shutting down our economy (with over 40 million people losing jobs, and many businesses closed by the government due to the pandemic) it doesn't look as though it has affected the DOM for Tempe. The DOM averaged the same in March as February and dropped to an all-time low of 31 in April. May saw an increase to 38. June also saw another increase up to 42 DOM, back to what the DOM was in February and March of this year, and July slightly dropped back to 41 DOM. August saw another decrease, back down to 31 DOM, and tying the all-time record low. September through December have increased each month, from the all-time low of 31 back to 45 DOM, which is higher than it has been all year since January, and higher than December of 2019.
Days on market (DOM) is a measure of the age of a real estate listing. It is the total number of days a listing is on the active market before an offer is accepted on the property, or an agreement between the real estate broker and home seller ends. The higher the days on market, the longer it is taking for homeowners to sell their Tempe home. The lower the days on market, the faster a Tempe home is receiving a purchase contract and getting off the market.
Generally, properties with a longer DOM will command lower prices than properties with a shorter DOM because a perception exists that the property may be overpriced or less desirable the longer it remains on the market. DOM often factors into developing a pricing strategy. DOM can also be used to gauge the condition, or trend of the housing market. Previous history has shown that a fairly stable real estate market in Tempe should have average days on the market somewhere between 60 and 90 days.
Generally, properties with a longer DOM will command lower prices than properties with a shorter DOM because a perception exists that the property may be overpriced or less desirable the longer it remains on the market. DOM often factors into developing a pricing strategy. DOM can also be used to gauge the condition, or trend of the housing market. Previous history has shown that a fairly stable real estate market in Tempe should have average days on the market somewhere between 60 and 90 days.
Tempe New Listings by Month:
Click image below to enlarge!
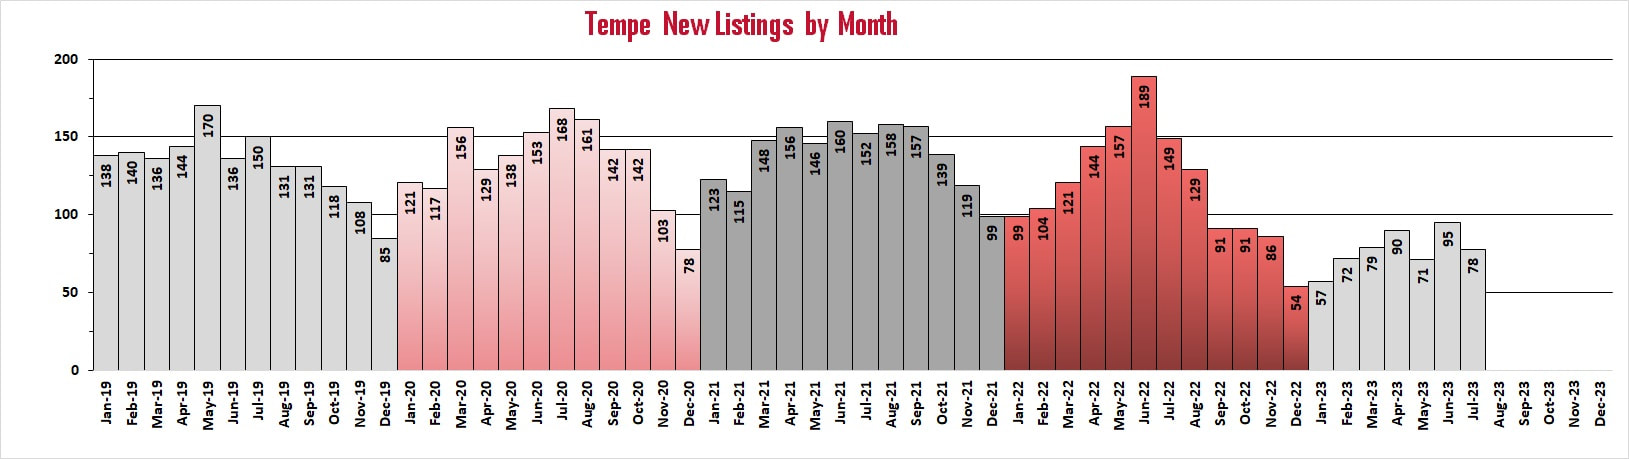
2023
There was a slight uptick in the number of new Tempe listings to start 2023, and that uptick has continued through April, although it remains low compared to previous years. The last three months have fluctuated up and down.
2022
The number of Tempe new listings remained the same to start off 2022 as it was in December of 2021. This is the first time in the last four years that the number of new listings did not increase in January to start off a new year. It is also the lowest number of new listings in Tempe for January in the last four years. The number of new listings in Tempe increased each month in 2022 through June and is now higher than it has been since August of 2018. However, July saw the first decrease, and the number of new listings in Tempe is now lower than in July of the last three years. New listings in Tempe declined for three straight months through September, with October remaining the same as September. November and December both decreased to end 2022.
2021
The number of new listings in Tempe jumped in January to start off the new year, but this is the typical pattern in the real estate cycle. The number of new listings in January of this year was almost the same as it was in 2018 and 2020. There has been a lack of listings in Tempe over the last two plus years, and it looks like it is going to continue in 2021. The number of new listings dropped even lower in February. The number of new Tempe listings increased in March, and slightly increased in April. May saw a slight decrease in the number of new listings, and June saw another increase, as new listings continue to fluctuate. July saw a decline in new listings to 152, and August barely increased to 158. September dropped down one, to 157, but this is the seventh straight month that new listings in Tempe have been over 145, which is a record. October finally dropped below 145, and November and December continued dropping down to 98 to end the year. Tempe still needs a lot more listings in order to keep up with demand.
2020
The number of new listings in Tempe started slowing in 2020, with just 121 new listings in January. Then it increased in March to 156 new Tempe listings, but then the Coronavirus hit the US Housing market and shut down our economy in the middle of the month. We will have to see if this trend continues as the economy begins to open up again. Over 40 million people have lost their jobs, and many businesses have been closed by the government due to the pandemic. New listings in Tempe decreased in April to 129, down 15 from April of 2019, but then increased 3 months straight, up to 168 for July. August through December has seen a decrease in new listings from 142 down to 78 new listings in Tempe. However, this is pretty typical for this time of year as we begin to enter the new year.
2019
The number of new Tempe homes for sale started off January at 138, but then maintained about that same number through April. May saw an increase of new Tempe listings up to 170, but then they dropped off again, and slowly decreased from August through December.
Check Out Our Housing Reports in Other East Valley Cities:


"Real Estate is not just a job for me, it's about making a difference in the lives of others"
Troy Erickson Realtor - Representing Buyers, Sellers, and Investors in the Phoenix East Valley:
Chandler, Sun Lakes, Ocotillo, Ahwatukee, Gilbert, Tempe, Mesa, Queen Creek, San Tan Valley, Scottsdale, Phoenix, and more!
Chandler, Sun Lakes, Ocotillo, Ahwatukee, Gilbert, Tempe, Mesa, Queen Creek, San Tan Valley, Scottsdale, Phoenix, and more!