Chandler Real Estate Market Reports:
Chandler, Arizona Home Sales Prices: |
Click image below to enlarge!
2023
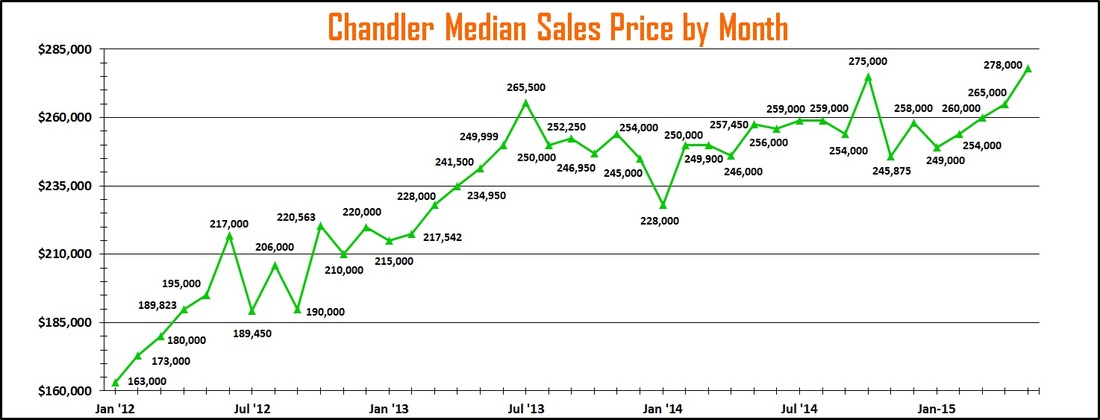
The new year started off with a dip in the median sales price for Chandler, but sales prices typically are low to start off a new year. Median sales prices have been slightly risen between March and May but have leveled off as of late.
2022
2022 started off with a dip in the median sales price of Chandler homes, which has been typical in years prior to 2020. However, February and March have seen fairly large increases in the median sales price of Chandler homes. April saw another drop in median sales prices as interest rates rise, while May saw another pretty good increase in the median sales price of Chandler homes. June saw another decrease in the median sales price, and July saw a slight increase. August saw another decrease while September increased. October saw another decrease while November increased. Over the last nine months the median sales price has been alternating between increasing and decreasing. The median sales price of Chandler homes is 0.6% higher than in December of 2021 to end the year. Home price increases have slowed down from the rate they had been increasing between June of 2020 and May of 2022.
2021
After a large increase in January, Chandler home prices took a dip in February, back to December 2020 prices, as the inventory remains low. I believe demand for homes remains high, and overall prices will continue to move upward. After 5 straight months of increasing, the Chandler median sales price slightly dropped two straight months down to $490,000 but bounced back up to a new all-time high of $510,000 in October. November saw another drop in the median sales price for Chandler homes. The year ended with another fairly significant increase in the median sales price of Chandler homes, to a new all-time high of $535,000. The median sales price of Chandler homes is 27.4% higher than in December of 2020. This means that if you would have purchased a home last November for say $400,000, it could be worth around $509,600 today, which is a pretty good way for anyone to build wealth.
2020
The median sales price of Chandler homes looks like it is continuing to increase in 2020. Even as the Coronavirus hit the US Housing market and shut down our economy in March, home prices increased. We will have to see if home prices can withstand the economic shutdown long-term, as over 40 million people have lost their jobs, and many businesses have been closed by the government due to the pandemic. Home prices did decrease in April and May due to the pandemic but are still higher than any year before 2012. June through August has shown a nice rebound, as Chandler continues to break records with the highest median sales price ever in August at $410,000. September saw a drop-off of the median sales price in Chandler down to $397,500, although I wouldn't be too concerned about this. Overall, the median sales price is still much higher than the beginning of the year, and this may go right back up next month. The median sales price in Chandler did bounce back up to $409,500 in October but dipped again in November. However, the median sales price in December jumped back up to the highest it has ever been, at $420,000! Overall, the median sales price increased by $55,000, which was a 15.1% increase in 2020. In comparison, for 2019 we saw a 19.5% increase, in 2018 we saw a 6.8% increase, and in 2017 we saw a 7.1% increase.
2017-19
The median sales price of Chandler homes continues to increase for the eighth straight year. 2017 saw Chandler median home prices reach over $300k for the first time since reporting this data back in 2012. In January of 2012 the median price of a home in Chandler was $163,000, and by December of 2019 the median price of a Chandler home increased to $360,000, representing a 54.7% increase in 8 years (or an average increase in value of 6.8% annually). I am not sure how long Chandler home prices can continue to increase at that same pace, but so far it doesn't look like home prices in Chandler will be decreasing any time soon.
Chandler, Arizona Home Sales:
Click image below to enlarge!
2023
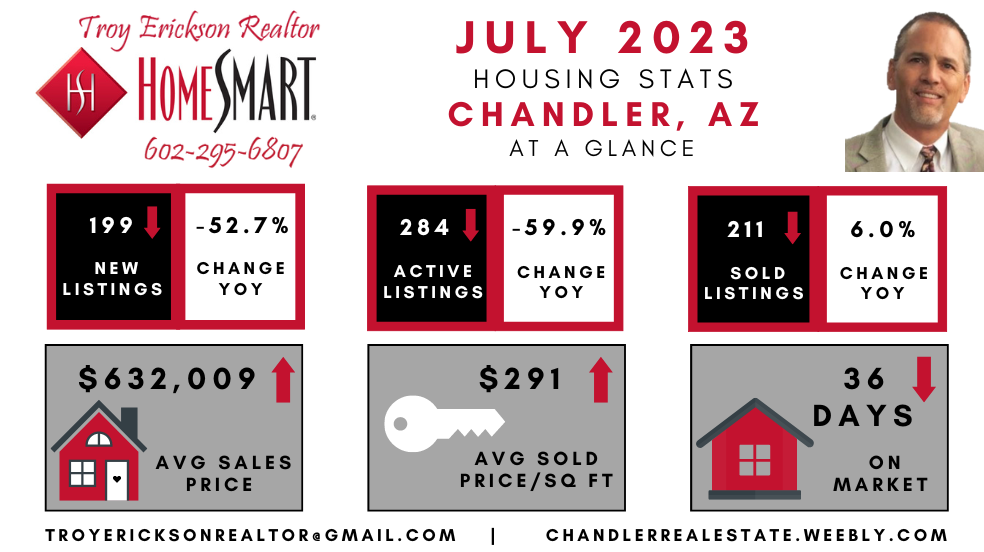
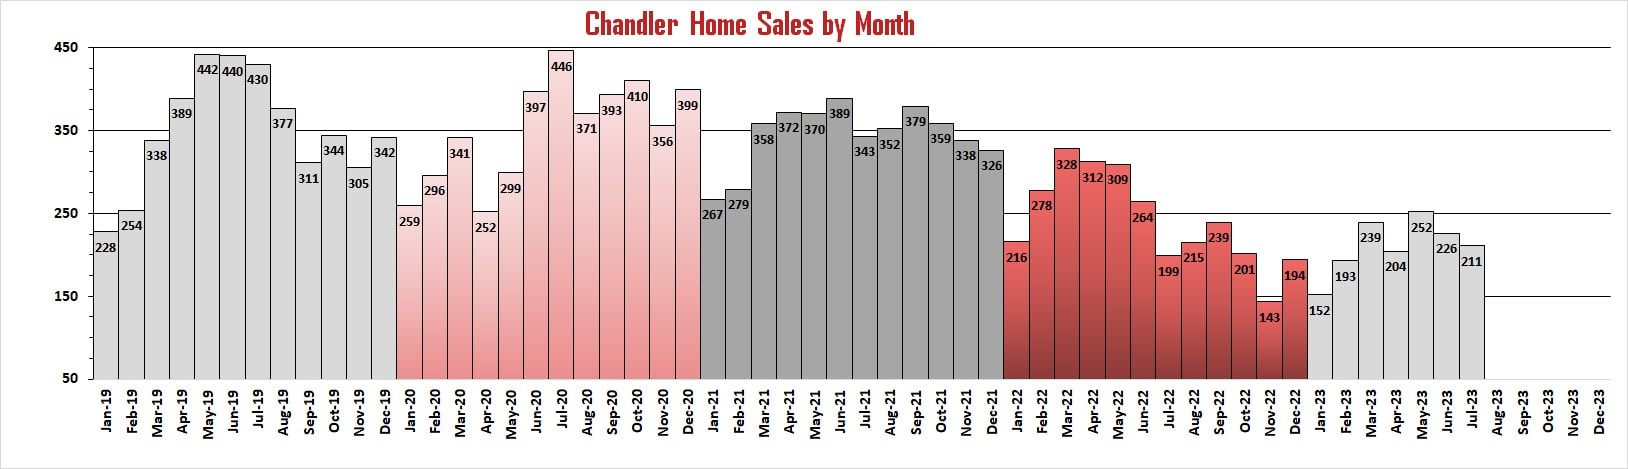
Home sales for Chandler started 2023 off with a very slow start. The lowest number of homes sold since before 2019. Home sales increased through May overall but have decreased since then.
2022
Chandler home sales for January 2022 are the lowest they have been since January of 2015, as we continue to struggle with low inventory. Home sales in Chandler increased for February and March but have decreased in April through July. May, June, and July are typically the high selling months for real estate in Arizona, so the fact that we saw a decline in those months is a sign that the housing market is shifting. August saw a slight increase in home sales, as did September. Even though we are seeing increases at a time where typical home sales decrease, Chandler home sales are significantly lower this time of year than in previous years. October and November have seen a fairly large decrease in home sales, much lower than in the previous three years. December saw a nice increase in home sales, but this has been the norm since people are wanting to make their purchase before year-end.
2021
Chandler home sales started off 2021 just about the same as the previous two years. Although home sales have remained pretty steady over the last three years, home sales in Chandler, AZ would be much higher if more homes were being listed for sale. Would have liked to have seen a larger increase of homes sold in February, but at least it was an increase. March saw a significant increase in Chandler home sales, the highest number of sales in March since 2018. April saw a slight increase over March, but May saw a slight decrease, which is not typical for this time of year. May is usually the month with the highest number of home sales, and I believe the lack of inventory of homes for sale has contributed to the low number of sales this month. June saw an increase in Chandler home sales, which is promising news. However, July saw a decline in Chandler home sales, and is a typical sign that the high buying season is coming to an end. August and September have seen an increase in the number of Chandler homes sold, which again, is not typical for this late into the year. It's no surprise, however, that October through December has seen a drop in home sales.
2020
As you can see by the chart, home sales in Chandler are cyclical, with the most homes sold between March and August. Home sales in January and February started off much better than in 2019, but then the Coronavirus hit the US Housing market and shut down our economy in March. Home sales in March dropped to almost the same number of homes sold in March of 2019, and then significantly decreased in April. We will have to see if this trend continues, as over 40 million people have lost their jobs, and many businesses have been shut down by the government due to the pandemic. May saw an increase in home sales, but still over 140 fewer sales than in May of 2019. June and July have seen a nice rebound, as the number of home sales increased by 146 in the last 2 months, with July actually having more home sales than in July of 2019. August is typically where we start to see fewer home sales, as families settle down once school starts, and this year it looks to be right on schedule. August home sales dropped to 371, which is just 6 sales fewer than in 2019 for this time of year. September saw a slight increase in the number of home sales, and October jumped even higher, extending the high-sales season longer this year, I feel, due to the coronavirus. November saw a typical drop-off in home sales as we start to head into winter and the slow season, but December saw another increase, which is not unusual, but the total sales are significantly higher this time of year than the previous 3 years. Even though we saw a nice increase in home sales towards the end of the year, 2020 Chandler home sales were almost exactly the same as in 2019 as a whole.
2017-19
After 2016 saw the highest total number of homes sold in Chandler, AZ since 2011 (which was when home prices were the lowest after the housing crash of 2007) there has been a slight decrease in total homes sold in Chandler for the period of 2017 through 2019, but it is not significant. In 2016, total homes sold in Chandler were 4,598, and that number is just over 4,000 for 2019. Part of the reason for the decrease in homes sold is due to the low inventory of homes for sale, as well as the fact that home values are increasing, which is pricing some potential home buyers out of the market because they just can't afford it. It will be interesting to see how the higher home prices, and steady interest rates will impact the number of homes that will be sold in Chandler in 2020. Currently it still looks like it is a sellers' market, but it is also not a bad time to buy a home in Chandler. As long as home prices continue to increase, and interest rates remain low, you can buy a home with a low mortgage payment, and gain equity over the months and years you own your home.
Chandler, AZ Home Inventory:

2023
Home inventory in Chandler saw another decline to start the new year, but it is rather typical since it is the slowest part of the housing market season. Home inventory continues to decline throughout 2023 as fewer homeowners look to sell.
2022
Chandler home inventory remains the lowest it has ever been, dropping to 313 to start January of 2022. Home inventory in Chandler has not increased much through March of this year. April and May have seen a fairly decent increase in home inventory up to 433, but still way below the 838 homes in 2019 before Covid-19. Home inventory typically starts to decline in June, so next month will be a good test as to whether there is a shift happening in the housing market. June saw a large increase in Chandler home inventory, followed by another large increase in July and August, and a small increase in September, which is a certain sign that the housing market is shifting. After increasing for eight months in a row, Chandler inventory has decreased October through December, as fewer homeowners are putting their home on the market as we get through the slow winter months.
2021
The number of Chandler homes for sale remains very low, as the demand from buyers continues to outpace the supply of homes for sale. After January started off with the all-time low of Chandler homes for sale at 315, February saw a slight increase in the number of homes for sale in Chandler, as did March and April. May saw a small decrease in the number of Chandler homes for sale, while June through October has seen an increase each month, up to a high of 475 for 2021. After five straight months of Chandler home inventory increasing, November and December home inventory dropped. With the recent inventory decrease, Chandler home inventory for November this year is 41.3% less than it was in 2019 (not using 2020 numbers due to COVID-19 pandemic).
2018-20
The inventory of homes for sale in Chandler started climbing in 2018 and reaching a high of 830 in June. Then inventory gradually decreased throughout the remainder of the year, ending a little higher than it started the year. January of 2019 saw a continued decline in Chandler inventory, but then shot up to a new all-time high of 838 in May. Since then, the Chandler home inventory continued to decline throughout the year, and into 2020. When Covid-19 hit early in 2020, inventory in Chandler saw increases in April and May, but once the housing industry opened up again, Chandler inventory continued to decrease throughout the remainder of the year, reaching a new all-time low of 374 in December. The average yearly inventory has dropped by 31.6% between 2018 and 2020!
With the average number of Chandler homes sold in the last 6 months increasing to 221, and with the inventory decreasing from 307 to 284, this leaves us with a decreasing absorption rate of 1.29 months, which is still reflective of a sellers' market.
How inventory affects home prices:
When the inventory of homes in Chandler increases, the economics of supply and demand will take effect. When there is a large inventory of homes available for sale in Chandler, home prices will decrease in value for a couple of reasons. One reason is because there are more homes for Chandler home buyers to choose from. Buyers will take their time in selecting a home, causing homes to stay on the market longer and increasing inventory. Because there are more Chandler homes for sale, home sellers will begin to lower their sales price in order to get their home sold.
When the inventory of homes in Chandler decreases, you will start to see an increase in home prices. With a low inventory of homes, Chandler home sellers know that they can ask a higher price because there are more buyers in the market than homes for sale. Homes tend to sell faster, and for more money when inventory is low. There are fewer choices for Chandler home buyers, and sometimes you will have to offer a higher than list price to get the home you want.
When the inventory of homes in Chandler decreases, you will start to see an increase in home prices. With a low inventory of homes, Chandler home sellers know that they can ask a higher price because there are more buyers in the market than homes for sale. Homes tend to sell faster, and for more money when inventory is low. There are fewer choices for Chandler home buyers, and sometimes you will have to offer a higher than list price to get the home you want.
Chandler Days On Market:
Click image below to enlarge!

2023
The days on market in Chandler lowered just a little to start off the new year but is still the highest January since before 2019. Chandler DOM has decreased since March but remain slightly higher than the previous two years.
2022
Chandler days on market increased from 30 to 31 to begin 2022. This is the highest DOM since January of 2021. February through May saw Chandler DOM decrease from 31 to 20. June through November has seen an increase in DOM each month. Chandler DOM is now the highest it has been since before 2019. It is typical to see an increase in DOM towards the end of each year, as the DOM has now more than tripled over the last 8 months. Now at 69 DOM, this is coming closer to a more balanced housing market.
2021
The number of days on market for Chandler increased to 37 DOM in January to start off 2021. This is pretty typical for this time of year, but overall, the days on market is extremely low due to the low inventory of homes for sale, and high buyer demand. February saw a huge drop in days on market, and after dropping for the third consecutive month and reaching a new all-time low of 21 in April, the DOM remained the same in May. June reached a new all-time low of 20 DOM, as homes in Chandler continue to sell faster than they ever have before in 2021. July saw the first increase in DOM this year, as it moved up to 23, but August saw the DOM fall back down to tie its all-time low of 20. September saw the second increase in DOM this year, up to 24. October saw the second increase in DOM in a row for the first time since December of 2020, and January of 2021, and is now at 27. After November DOM remained the same as October, at 27, the DOM for December increased again up to 30. This is the third increase in the last four months, but is more typical this time of year, as the Arizona housing market slows down.
2020
January of 2020 saw a new low for DOM to start a new year, at 50. DOM have gone down each month to a low of 32 in May. Even though the Coronavirus hit the US Housing market and shut down our economy in the middle of March, it doesn't seem to have impacted how long it takes to sell a home in Chandler. We will have to see if this trend continues, as over 40 million people have lost their jobs, and many businesses have been shut down by the government due to the pandemic. June saw an increase up to 39 DOM, and since then the DOM has decreased down to a new all-time low of 28 in November. December saw a slight uptick to 32 DOM, which is pretty typical for this time of year. However, the DOM is still extremely low due to the high demand. The average days on market in Chandler has gone from 54.75 in 2017 to 37.50 in 2020, a decrease in almost 20 days.
2017-19
January of 2019 saw the Chandler DOM at the lowest (53) to start off a year since I have been tracking this back to 2013. There has been an overall steady decline in DOM since the middle of 2015, reaching a low of 39 DOM in October of 2019. As long as the inventory of homes for sale and interest rates remain low, homes will sell fast because competition is high.
Chandler New Listings by Month:
Click image below to enlarge!
2023
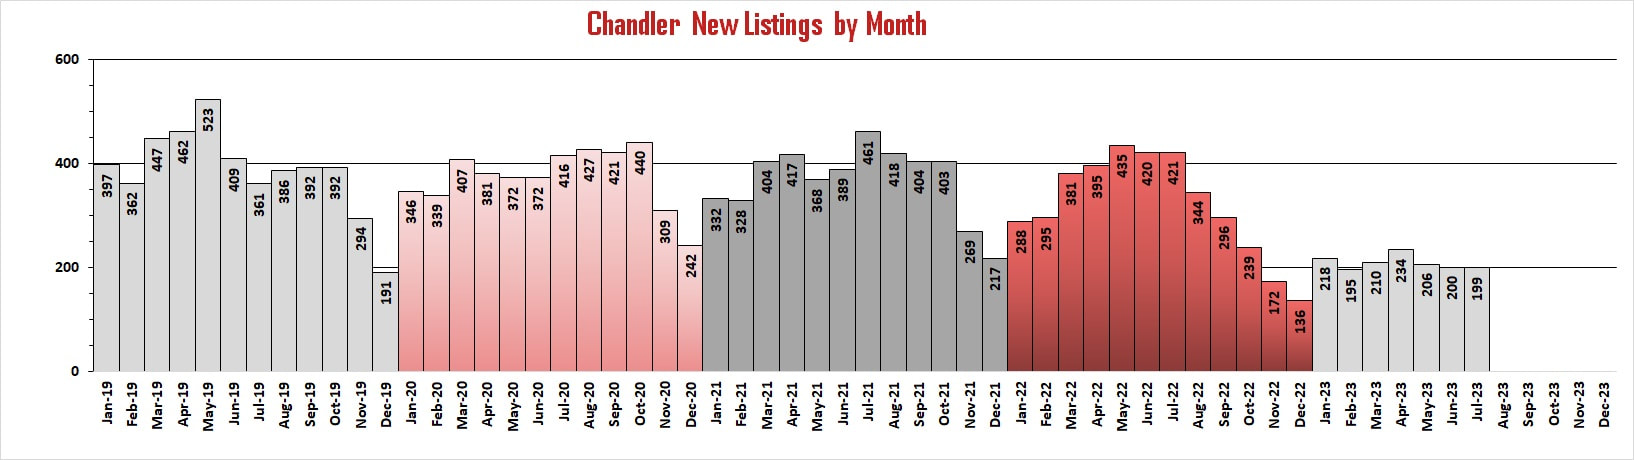
The number of new listings in Chandler climbed in January but is still the lowest January since before 2019. The number of new listings in Chandler remains very low throughout 2023.
2022
The number of new listings has increased every month through May of 2022, and May now has more new listings than in May over the last two years. June saw a slight drop in new listings and July remained almost the same as June. We no longer have a shortage of homes for sale, but fewer homes are selling and that is increasing the overall housing inventory, which means the housing market is shifting. August through December has seen a decline in new listings as we head into the slowest part of the housing season here in Arizona.
2021
The number of new listings for January started off even lower than the previous two years, which is a sign that the number of homes being listed for sale continues to be extremely low. Even as home prices continue to grow at a record pace, it hasn't convinced more homeowners to sell. Lack of inventory of Chandler homes for sale could continue to be an issue for a while. The number of new listings decreased in February, just as it has over the last three years. It is pretty typical to see a drop in new listings this time of year, but in March we should start seeing increases.
March did see a nice increase in the number of new listings in Chandler, almost reaching last year's total for the month, while April saw a slight increase. May saw a decrease in the number of new listings in Chandler, which is not typical for this time of year. June saw an increase in the number of new Chandler listings, as did July, up to a high of 461 for 2021. This is the highest number of new listings for July over the last 4 years. This could be a sign that more home sellers are finally ready to sell due to the bidding wars and may help relieve the escalating sales prices. Since July, new listings have declined for five straight months, from a 2021 high of 461 in July down to 217 in December. However, it is typical to see the number of listings drop off towards the end of the year, so this is not concerning (look at Sept through Dec of 2018 and 2019).
2020
The number of new listings has been decreasing for some time, and it looks like 2020 will see more of the same. March did see an increase of new listings, even though the Coronavirus hit the US Housing market and shut down our economy halfway through the month. We will have to see if the number of new listings continue to decrease throughout 2020, as over 40 million people have lost their jobs, and many businesses have been shut down by the government due to the pandemic. New listings in April through June have dropped but are just 37 fewer than in June of 2019. July and August saw a slight increase up to 427 new listings while September took a slight drop but is still higher than the previous 3 years. October saw another increase to an all-time high of 440 new Chandler listings for 2020. November is typically when we see a large drop-off as we head into the slow months. We will have to see if that trend continues this year. So, it looks like November did see the expected drop-off in new listings as we head into the winter months, and December followed with another fairly significant decrease. The last 6 months of this year has seen a higher inventory of homes than in 2019, which hopefully a good sign that there will be more homes for sale heading into 2021.
2017-19
January of 2017 had the lowest number (395) of new listings to start a year since I started tracking this data in 2012. That trend continued all year, ending up with the lowest number of new listings (5,020) since 2012 (4,965). However, there has been a slight increase in the number of new listings in January of 2018, but the final total of new listings for 2018 was almost exactly the same as 2017. In 2019, the total number of new listings for the year slightly decreased to 4,500. Many homeowners are hanging on to their homes longer since the real estate market crashed in 2007, even though their values have significantly increased. With interest rates remaining low, it will be interesting to see how that plays into whether people decide to sell in 2020 or continue hanging on to their current home and earning that equity.
Check Out Our Housing Reports in Other East Valley Cities:

"Real Estate is not just a job for me, it's about making a difference in the lives of others"
Troy Erickson Realtor - Representing Buyers, Sellers, and Investors in the Phoenix East Valley:
Chandler, Sun Lakes, Ocotillo, Ahwatukee, Gilbert, Tempe, Mesa, Queen Creek, San Tan Valley, Scottsdale, Phoenix, and more!
Chandler, Sun Lakes, Ocotillo, Ahwatukee, Gilbert, Tempe, Mesa, Queen Creek, San Tan Valley, Scottsdale, Phoenix, and more!