Ahwatukee Real Estate Market Reports:
Ahwatukee Foothills, Arizona Home Sales Prices: |
Click image below to enlarge!
2023
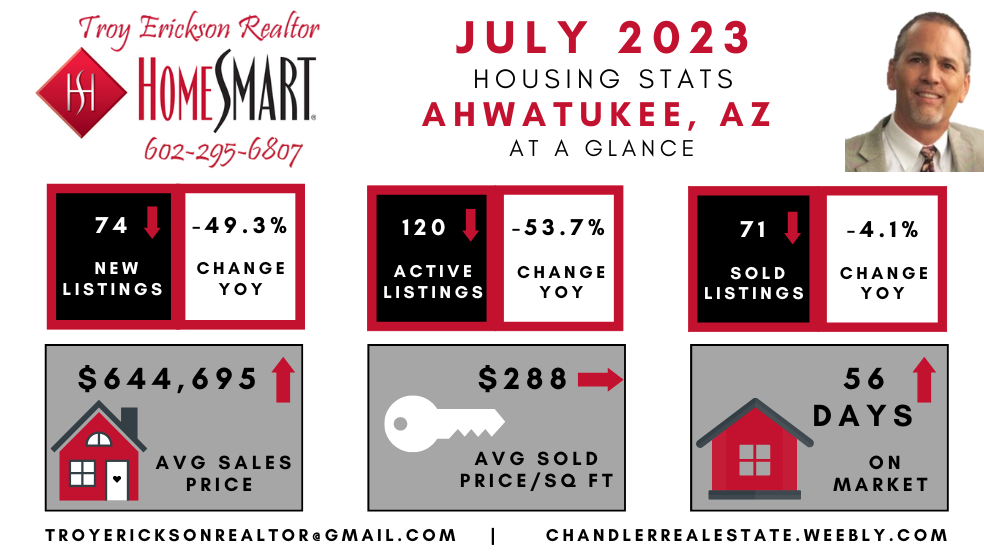
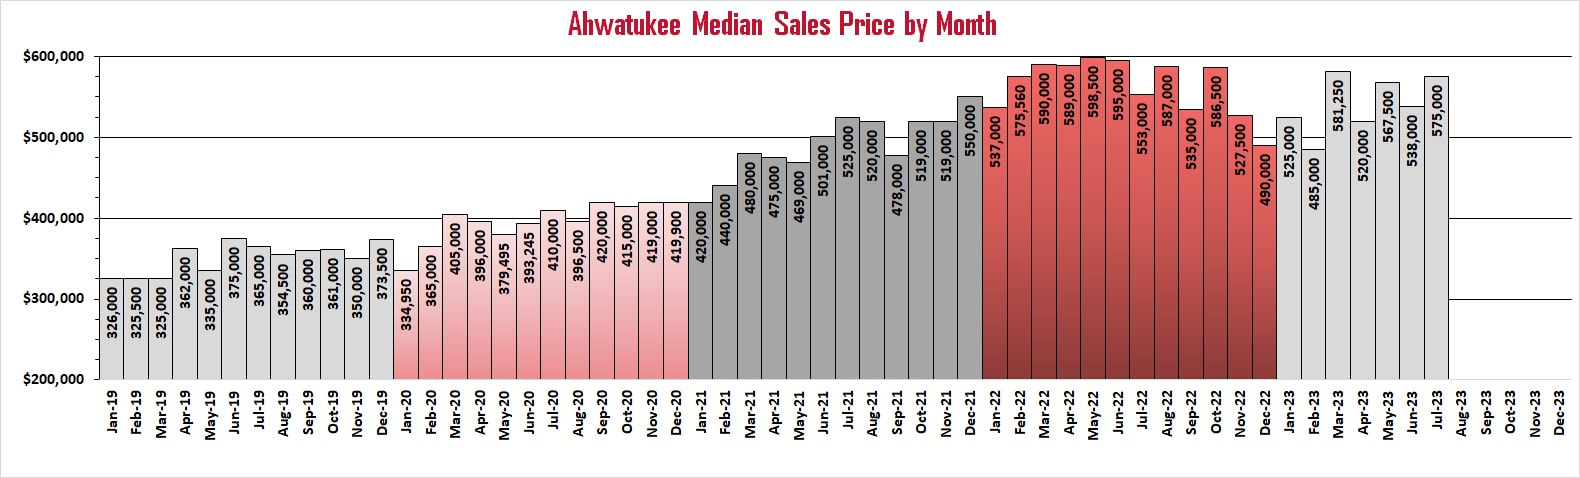
The median price of homes in Ahwatukee has been fluctuating up and down throughout 2023 with a slight upward trend.
2022
January median sales prices in Ahwatukee dropped from the previous all-time high in December to end 2021. As you can see by the chart, the median sales price in Ahwatukee often starts off the new year low since it is winter, and the slower season for real estate. Median home prices in Ahwatukee continue to climb in 2022 to a new all-time high of $598,500 in May. There was a slight decrease in June, and a larger decrease in July, but August saw a fairly large increase. September saw another decline in median sales price, but October saw a nice increase, which is unusual for this time of year. November dropped back down, and December remained the same. The median sales price of Ahwatukee homes is now -4.1% lower than in December of 2021.
2021
January median sales prices dropped off significantly in January of the previous two years but did not decrease at all to begin 2021. That may mean that median sales prices in Ahwatukee are still climbing. February and March saw large increases in the median sales price. April and May have seen a decrease in the median sales prices of Ahwatukee homes, which is different than most other East Valley cities. June and July have both seen decent increases in the median sales price of Ahwatukee homes, up to a new all-time high of $525,000. August saw a decrease in median sales price, and September saw an even larger decrease down to $478,000. October saw a nice increase in median home sales, and November remained almost unchanged. December saw an increase in median sales price to a new all-time Ahwatukee high of $550,000. Overall, the median home price in Ahwatukee has increased 31.0% since December of last year.
2017-2020
The Ahwatukee median home sales prices have had a pretty steady increase over the last 4 years, from a low of $287,500 in January of 2017, to a high of $420,000 in September of 2020, and now January of 2021. Home prices seem to increase each year after the first few months of the year. They tend to drop off each year in November, but surge upward in December before falling to yearly lows in January.
As the Coronavirus hit the US Housing market and shut down our economy in mid-March, home prices have started to decrease. Home prices have dropped in April and May after rising sharply in March but are still much higher than any previous year back to 2012. We will have to see if home prices can withstand the economic shutdown long-term, as over 40 million people have lost their jobs, and many businesses have been closed by the government due to the pandemic. June and July have seen increases to the median sales price of homes up to $410,000, as the economy tries to get going again. August saw a slight decrease as the housing market begins its annual fall slowdown, but September saw a fairly large increase to an all-time high of $420,000, which is not typical this late into the year. October saw a dip, but November and December bounced back up to almost what it was in September.
Ahwatukee Foothills, Arizona Home Sales:
Click image below to enlarge!
2023
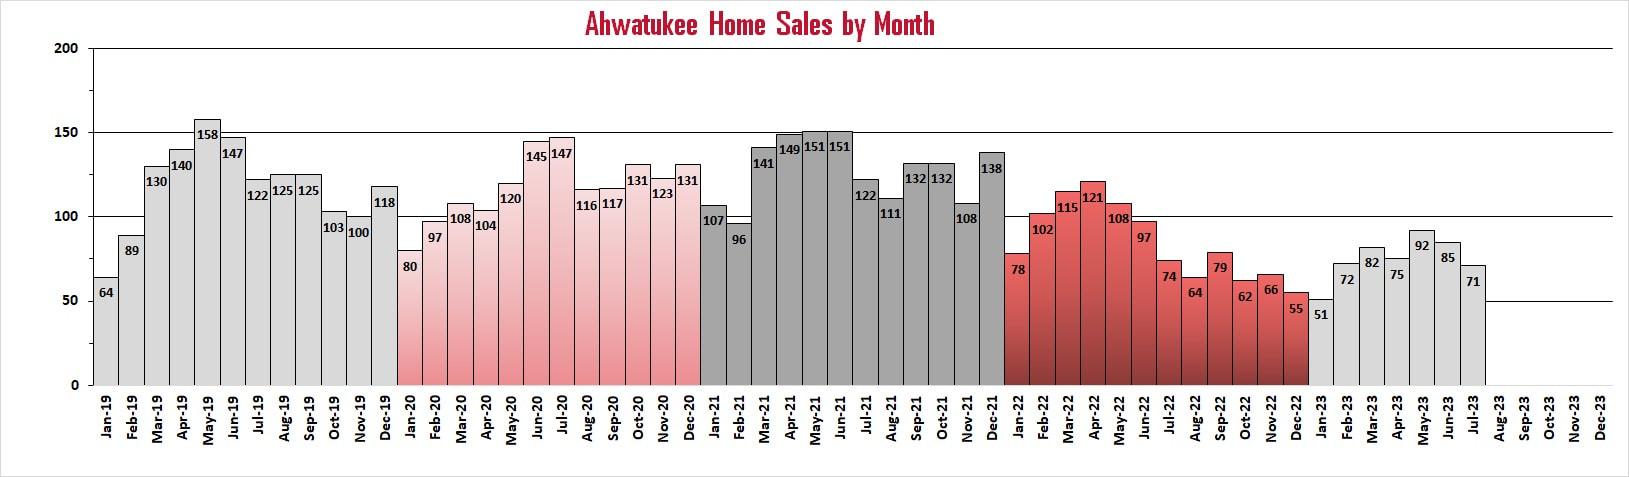
Home sales have started 2023 lower than the previous 4 years partially due to low inventory. They have fluctuated up and down but have decreased the last two months. Ahwatukee home sales remain low compared to previous years.
2022
Home sales in Ahwatukee started off January of 2022 lower than in the previous two years. January is always a slow month for sales due to the seasonality of home sales in Arizona. So far in 2022 home sales in Ahwatukee have increased three straight months up to 121 in April. May through August has seen a decline in Ahwatukee home sales at a time where home sales are usually increasing. September saw an increase in home sales when this is usually the time of year when home sales begin to slow. October saw another decline in home sales, but November saw another increase. December decreased again as we finished up 2022.
2021
The number of Ahwatukee home sales started off the new year the highest it has been over the last three years. Even though inventory has been low over the last two years, home sales have not dropped off. There is still high demand for homes in Ahwatukee. However, February saw a drop off in home sales, partially due to the lack of inventory of homes for sale. Hopefully March will see an increase as we head into the busy season. March did see a significant increase in home sales, followed up by slight increases in April and May. June remained the same as May and is higher than the last three years for that month. Typically, June is the first month we will see a decline in home sales as we pass the peak buying months of the season. July saw a decrease in home sales, which is pretty typical as the housing market begins to slow down once school starts and we begin heading into the fall. August saw another decrease in Ahwatukee home sales, which is now the lowest number of home sales in August over the last four years. September saw an increase in home sales for the first time in four years, and October remained the same as September. November dropped to the lowest number of sales since February but was still higher than in 2018 and 2019. December finished 2021 with a nice increase in Ahwatukee home sales, up to 137, the highest number of sales since June, and the highest number of home sales in December in the last four years.
2017-20
The number of Ahwatukee home sales has been pretty consistent over the last 3 years, with a difference of just 14 total sales between all 3 years. May of 2018 saw the largest number of home sales in Ahwatukee, coming in at 172 sales, while January of 2019 saw the fewest homes being sold in Ahwatukee, with 64 homes sold.
It looked like 2020 was getting off to a much better start than in 2019, but things started slowing in mid-March when the Coronavirus hit the US Housing market and shut down our economy. Although there was still an increase in Ahwatukee home sales in March, it didn't jump as in previous years. We will have to see if home sales can withstand the economic shutdown long-term, as over 40 million people lost their jobs, and many businesses were closed by the government due to the pandemic. April saw a slight decrease in home sales, but that month has seen a decrease in 2 of the last 3 years. Home sales in May through July started to climb back up, reaching a high for 2020 of 147 in July. August and September saw a significant drop-off in Ahwatukee home sales, but they are much higher than the previous 3 years. October saw a nice increase in home sales, which hasn't been the case since 2017. November saw slightly fewer home sales than the previous month but is significantly higher than this time of year over the last 3 years (where home sales usually start declining in July or August). 2020 ended the year with an increase in home sales.
Ahwatukee, AZ Home Inventory:
Click image below to enlarge!
2023
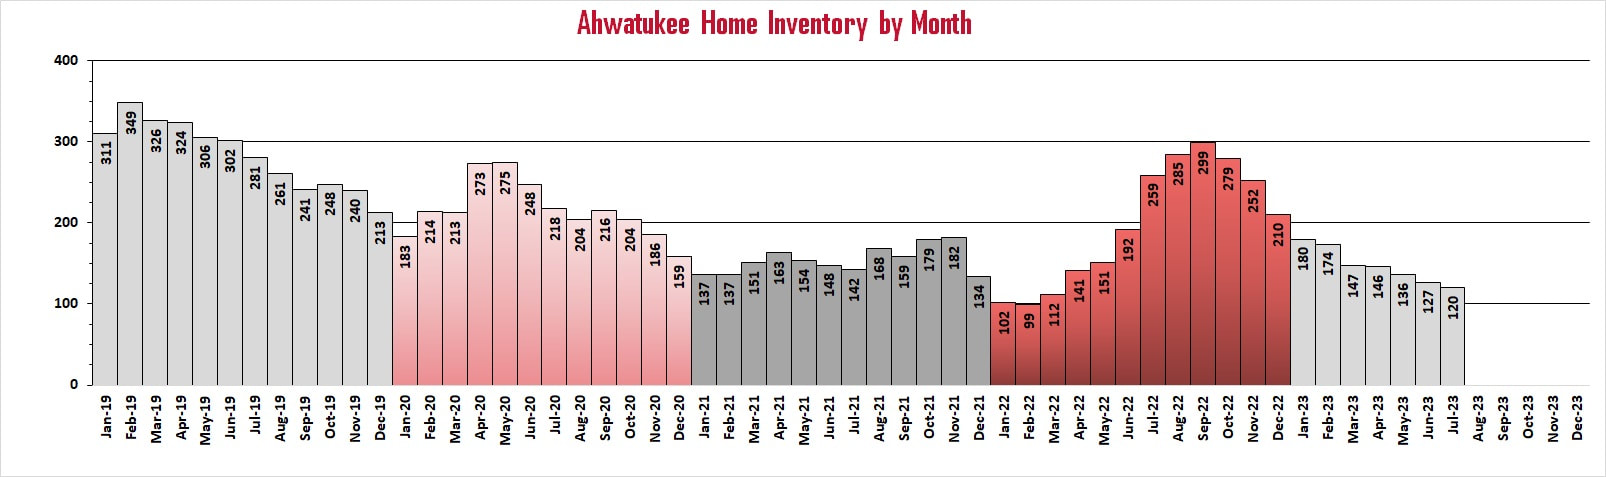
The home inventory in Ahwatukee has declined in January to start off 2023 and has now dropped for 10 straight months.
2022
Ahwatukee home inventory started January of 2022 as low as it has been in at least the last four years. February inventory dropped a little more, but then the home inventory in Ahwatukee increased for seven straight months, through September. During that time the inventory of Ahwatukee homes had more than tripled and was the highest it had been since June of 2019. October through December saw a decline in home inventory, which is typical for this time of year when the Arizona real estate market slows down.
2021
The inventory of Ahwatukee homes for sale decreased in January, the same as it has the last four years. February remained the same as January. Still, the lack of inventory of homes available for sale continues to increase home prices and demand. March and April saw small increases in the inventory of homes for sale in Ahwatukee but May saw a decrease. May has seen a decrease in home inventory in 2018 and 2019, so this is typical for Ahwatukee. June and July saw more declines in home inventory, but August saw an increase up to the highest it has been all year at 166. September did drop back down, but October and November saw an increase in inventory. December reached a new all-time low of 128 Ahwatukee homes for sale, as 2021 continues to have the lowest inventory of Ahwatukee homes available for sale in recent history.
2018-20
As you look at the graph above, you can see that the inventory of homes in Ahwatukee, AZ has decreased from a high of 380 in April of 2018 to an all-time low of 159 in December of 2020. Ahwatukee home inventory has seen a pretty steady decrease between February of 2019 through January of 2020. Since then, we have seen the inventory of homes in Ahwatukee increase from 183 in January to 275 in May, a 50% increase in 4 months. We will have to see if this trend continues, as the Coronavirus hit the US Housing market and shut down the economy. Over 40 million people were unemployed, and many businesses were closed by the government due to the pandemic. June through August of 2020 saw decreases in home inventory. Ahwatukee inventory of homes increased in September, but the rest of the year saw a steady decline, eventually reaching an all-time low of 159 homes for sale in December.
With the average number of Ahwatukee homes sold in the last 6 months increasing to 79, and home inventory decreasing from 127 to 120, this leaves an overall decrease in the absorption rate to 1.52 months, which is still representing a sellers' market.
How inventory affects home prices:
When the inventory of homes in Ahwatukee increases, the economics of supply and demand will take effect. When there is a large inventory of homes available for sale in Ahwatukee, home prices will decrease in value for a couple of reasons. One reason is because there are more homes for Ahwatukee home buyers to choose from. Buyers will take their time in selecting a home, causing homes to stay on the market longer and increasing inventory. Because there are more Ahwatukee homes for sale, home sellers will begin to lower their sales price in order to get their home sold.
When the inventory of homes in Ahwatukee decreases, you will start to see an increase in home prices. With a low inventory of homes, Ahwatukee home sellers know that they can ask a higher price because there are more buyers in the market than homes for sale. Homes tend to sell faster, and for more money when inventory is low. There are fewer choices for Ahwatukee home buyers, and sometimes you will have to offer a higher than list price to get the home you want.
When the inventory of homes in Ahwatukee decreases, you will start to see an increase in home prices. With a low inventory of homes, Ahwatukee home sellers know that they can ask a higher price because there are more buyers in the market than homes for sale. Homes tend to sell faster, and for more money when inventory is low. There are fewer choices for Ahwatukee home buyers, and sometimes you will have to offer a higher than list price to get the home you want.
Ahwatukee Days On Market:
Click image below to enlarge!
2023
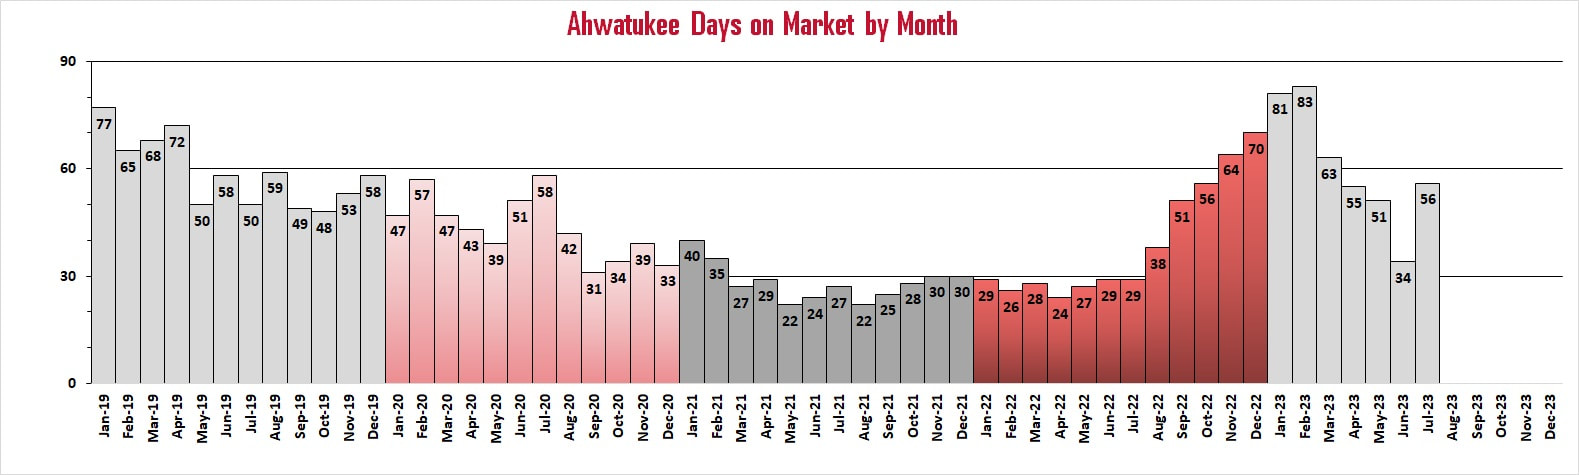
Ahwatukee days on market climbed for 7 straight months as we entered 2023. March saw the first decline and the DOM in Ahwatukee declined for 4 straight months. July saw an increase in DOM.
2022
The number of days on market in Ahwatukee for January decreased to 28 from 29 DOM in December of 2021. The Ahwatukee DOM decreased again in February before increasing back up to 28 DOM in March. April saw another decrease in DOM back down to 24 and May saw another increase back up to 27 DOM. June saw the second straight increase and is now up to 29 DOM, the highest we have seen in 2022. July saw another slight drop down to 28 DOM and August shot up to 38 DOM. The DOM has increased five straight months up to 70 DOM in December, which is the highest DOM for Ahwatukee since before 2019.
2021
The number of days Ahwatukee homes are on the market before they sell increased in January, but still remains very low compared to the last three years. February saw a decrease back down to 35 DOM, and March saw another decrease to an all-time low of 26 DOM. April saw an increase back up to 29 DOM, but May dropped to a new all-time low of 22 DOM. June saw as slight increase in Ahwatukee DOM, and July saw another increase for the second month in a row, up to 27 DOM. August DOM dropped back down to 22, tying the all-time record low for Ahwatukee. September, October, and November have seen a gradual increase up to 30 DOM, which is still very low. December DOM barely increased to 30 to finish 2021. High demand and low inventory are the reasons that homes are selling so quickly.
2017-20
As you can see by the graph, Ahwatukee Days on Market has a very U-shaped curve which shows the DOM has been higher at the beginning of each year, decreasing through the spring and summer months, and then increasing again at the end of each year. However, DOM in Ahwatukee as an average has been on a downward trend over the last 4 years. In 2017, the highest DOM was 84, with a low of 49, and an average of 70 days on market. By 2019, the average Days on Market for a home in Ahwatukee dropped to 55.
The Ahwatukee days on market started 2020 with an all-time low of 48 for January. It jumped up to 57 DOM in February, and then the Coronavirus hit the US Housing market in mid-March and shut down our economy. We will have to see if DOM will increase in the coming months, or if it can withstand the economic shutdown long-term, as over 40 million people have lost their jobs, and many businesses have been closed by the government due to the pandemic. The DOM dropped in March and remained the same in April. The DOM in May decreased again, to a low of 39. The DOM increased in June to 51, and increased up to 58 in July, which is the highest it has been all year. However, things seem to be getting back to normal, as the DOM for August took a significant drop back down to 42, and September dropped even lower to an all-time low of 31. October and November have seen a steady increase in days on market back up to 39, yet still lower than any month in the past 3 years. December dropped back down to 33 DOM.
Days on market (DOM) is a measure of the age of a real estate listing. It is the total number of days a listing is on the active market before an offer is accepted on the property, or an agreement between the real estate broker and home seller ends. The higher the days on market, the longer it is taking for homeowners to sell their Tempe home. The lower the days on market, the faster an Ahwatukee home is receiving a purchase contract and getting off the market.
Generally, properties with a longer DOM will command lower prices than properties with a shorter DOM because a perception exists that the property may be overpriced or less desirable the longer it remains on the market. DOM often factors into developing a pricing strategy. DOM can also be used to gauge the condition, or trend of the housing market. Previous history has shown that a fairly stable real estate market in Ahwatukee should have average days on the market somewhere between 60 and 90 days.
Generally, properties with a longer DOM will command lower prices than properties with a shorter DOM because a perception exists that the property may be overpriced or less desirable the longer it remains on the market. DOM often factors into developing a pricing strategy. DOM can also be used to gauge the condition, or trend of the housing market. Previous history has shown that a fairly stable real estate market in Ahwatukee should have average days on the market somewhere between 60 and 90 days.
Ahwatukee New Listings by Month:
Click image below to enlarge!
2023
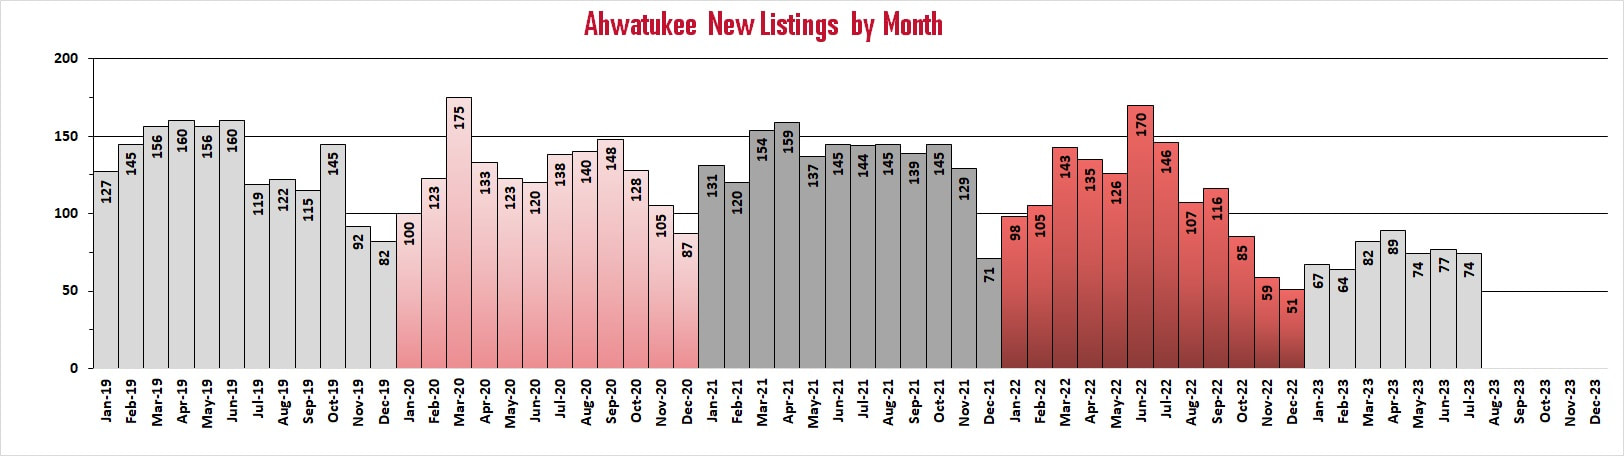
New listings in Ahwatukee increased in January to start off 2023 and has slightly increased through April. May through July have remained almost the same, much lower than in previous years.
2022
New listings in Ahwatukee shot up in January to start off 2022, just like they have over the last three years. With that said, the number of new Ahwatukee listings this January is less than the number of new January listings in the last three years. Ahwatukee new listings continue to increase through March of 2022 but remain lower than the previous three years. April saw a decrease in new listings for Ahwatukee for the first time in 2022 and May followed with another decrease. However, June saw another increase in listings, to the highest it has been in Ahwatukee since March of 2020 (when Covid-19 shut everything down). July and August both saw a decrease in new listings. September saw another increase in new Ahwatukee listings, which is unusual this late into the year. October through December has seen decreases in new Ahwatukee listings which is more typical for this time of year as we end 2022.
2021
New listings in Ahwatukee started off 2021 with a large increase, significantly more listings than in January of 2020. The increase in home values over the last two years has not influenced home sellers to list their homes in the last two years. Perhaps 2021 will see more listings of homes for sale in Ahwatukee. February saw a decrease in new listings, while March saw a large increase in new Ahwatukee listings, and April saw a slight increase. May saw a decrease in the number of new Ahwatukee listings, while June saw another small increase in new listings. July saw another slight decrease in the number of new listings but is still the highest number for July over the last three years. August saw new listings remaining higher than over the last three years, at 145, and September slightly dropped down to 139. October slightly increased back to 145, and November dropped to 129, the lowest number of new listings since February, but still much higher than the previous three years. December saw the lowest number of new listings in Ahwatukee in at least the last four years, reaching a low of 71. Overall, the number of new Ahwatukee listings this year are higher than they have been since 2018.
2017-20
New listings in Ahwatukee have been decreasing over the last three years, from a high of 1,808 (151/mo. avg.) in 2017 to a low of 1,579 (132/mo. avg.) in 2019, and that trend looked to be continuing in 2020. The first two months of 2020 had the lowest number of new listings over the last four years by far, just 223 new listings compared to 324 new listings in 2017. However, the Coronavirus hit the US Housing market in mid-March and shut down our economy. It does look like that may have impacted the number of new listings in Ahwatukee, as they shot up in March to a high of 175, which hasn't been that high since April of 2018. However, April saw a pretty significant drop back down to even lower levels than in the past three years. We will have to see how the economic shutdown will affect the number of new listings in Ahwatukee long-term, as over 40 million people have lost their jobs, and many businesses have been closed by the government due to the pandemic. May and June have also seen a decrease in new listings, down to 120, but July saw an increase back up to 138. New listings in August and September continued to increase, and has gone up to 148, which is the highest number of listings in September over the last 3 years. October through December have seen new listings decrease, which is very typical for this time of year.
Check Out Our Housing Reports in Other East Valley Cities:


"Real Estate is not just a job for me, it's about making a difference in the lives of others"
Troy Erickson Realtor - Representing Buyers, Sellers, and Investors in the Phoenix East Valley:
Chandler, Sun Lakes, Ocotillo, Ahwatukee, Gilbert, Tempe, Mesa, Queen Creek, San Tan Valley, Scottsdale, Phoenix, and more!
Chandler, Sun Lakes, Ocotillo, Ahwatukee, Gilbert, Tempe, Mesa, Queen Creek, San Tan Valley, Scottsdale, Phoenix, and more!