Gilbert Real Estate Market Reports:
Gilbert, Arizona Home Sales Prices: |
Click image below to enlarge!

2023
The Gilbert median sales price has slowly climbed over the last 5 months.
2022
The Gilbert median sales price slightly increased to start off 2022, after decreasing in December to end 2021. This is the first January increase in the last four years. Home prices have increased each month in 2022 until June, which may be signaling a slight shift in the housing market. July saw a slight increase, while August through October has seen a decrease in the median sales price of Gilbert homes. November saw a slight increase, while December saw a slight decrease. The median sales price of Gilbert homes is only 1.7% higher than in December of 2021.
2021
The median sales price of homes in Gilbert dropped to start off 2021, which also happened the previous two years, so this is no indication of any sort of change. I would predict that median sales prices in Gilbert will continue to grow as demand outpaces supply. February saw a large jump in the median sales price in Gilbert, just as predicted, as did March. April saw a decrease in the median sales price, but I would predict it continuing an upward trend throughout the year. Both May and June have seen Gilbert median sales prices of homes continue their upward trend after the slight dip in April. July saw another drop in median sales prices of Gilbert homes, but I would imagine the overall trend is still upward at this point and expect to see median sales prices increase in August. The median sales price of Gilbert homes did increase up to a new all-time high of $535,000 in August. The median sales price in Gilbert did decrease quite a bit in September, down to $500,000, but increased back up to $530,000 in October. The median sales price of Gilbert homes reached a new all-time high of $550,000 in November but dropped back down to $540,000 in December. The median sales price of Gilbert homes has increased 29.5% since December of 2020.
2020
Once again, the new year saw Gilbert home prices increasing, but the Coronavirus hit the US Housing market and shut down our economy in March. Over 40 million people lost their jobs, and many businesses were shut down by the government due to the pandemic. As you can see, home prices took a slight dip in March, and dropped a little more in April, probably due to the pandemic. However, things seem to be turning around, as there has been an increase in the median sales price in each of the following months (8 straight months), up to the highest median sales price ever at $430,000 in December. Overall, the median sales price increased by $71,750, which was a 20.0% increase in 2020. In comparison, for 2019 we saw a 9.1% increase, in 2018 we saw an 8.9% increase, and in 2017 we saw a 6.2% increase.
2019
Gilbert median home sales prices are continuing to increase, reaching an all-time high of $361,000 in November of 2019.
Gilbert, Arizona Home Sales:
Click image below to enlarge!
2023
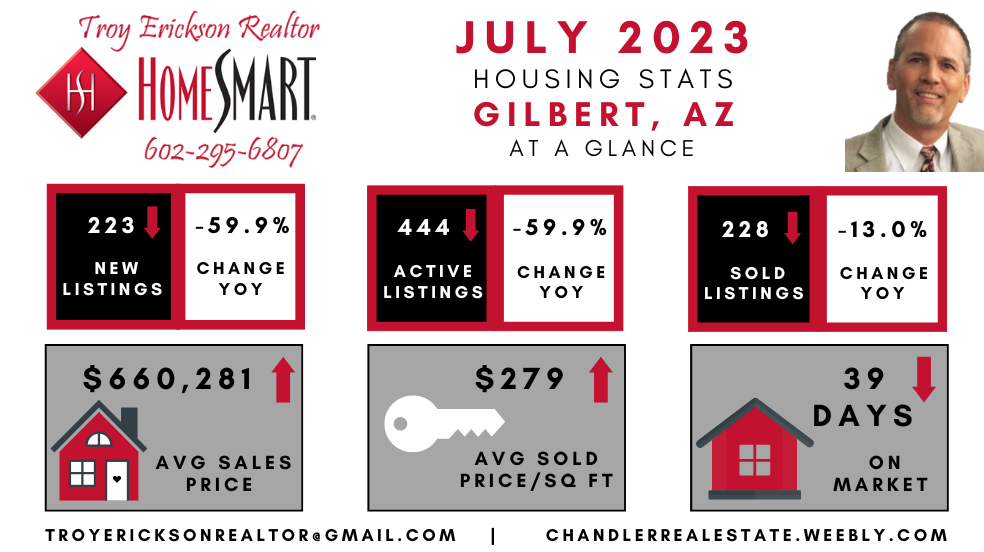
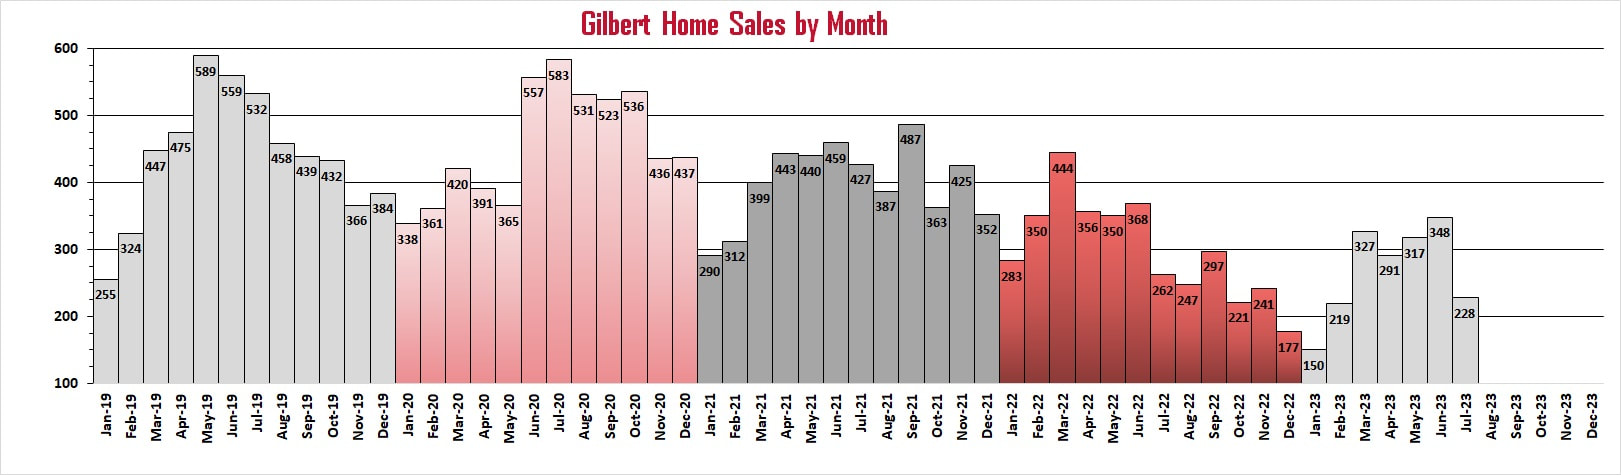
January is the lowest number of Gilbert homes sold since before 2019 as the new year started very slow. Home sales picked up March through June but dropped in July.
2022
Gilbert home sales dropped to start off the new year, decreasing from 352 sales down to 283, which is the lowest number of homes sold in Gilbert for January since January of 2019. Home sales in Gilbert increased in February and March but saw a sharp decline in April. Gilbert home sales slightly dropped again in May. June saw a small increase and then July saw a significant drop. August saw another drop in home sales, but September saw a nice increase. October saw another significant decrease, to the lowest number of home sales in Gilbert since before 2018 (in the last 5 years). November saw a slight increase as we head into the winter months, while December decreased to end 2022.
2021
Gilbert home sales started off 2021 with a huge drop-off from December of 2020, but as you can see on the graph, it is pretty typical for that time of year. Home sales are down from January of last year, but a large part of the issue is the lack of homes for sale. Home sales increased slightly in February, but March should see a more significant increase, as we head into the buying season. Both March and April have seen a nice increase in Gilbert home sales, with April surpassing 2020 numbers (due to the slowdown from the COVID-19 pandemic last year). May remained about the same as April, whereas in previous years May was the top month for Gilbert home sales. June saw another slight uptick, while July dropped. This could mean the end of the hot summer season as school is starting and summer is coming to an end. August saw another drop in Gilbert home sales, and the numbers are way below what we have seen over the last three years. However, September saw a large increase in Gilbert home sales, to 487, which is the largest number this year by far (and very unusual as we head into Fall). October significantly dropped to the lowest number of Gilbert home sales since February this year, but November saw a nice increase. We ended the year with a decrease in Gilbert home sales, down to 354 for December as we end 2021.
2020
Gilbert home sales started off the best it has been in the last 4 years, but then the Coronavirus hit the US Housing market and shut down our economy in March. As you can see, home sales were still on the rise in March, but did not increase as much as the previous 3 years. Gilbert home sales declined in April and May, and we will have to see if this trend continues, as over 40 million people have lost their jobs, and many businesses have been shut down by the government due to the pandemic. June and July saw an increase in the number of homes sold in Gilbert, up to 583 homes in July. This number is much closer to the norms for this time of year, as our economy is getting back to normal. August and September saw decreases in home sales, which is typical for this time of year, but the number of homes sold (531 and 523 respectively) are still much higher than in August and September of the last three years (averaging 444 sales). October saw a slight increase in Gilbert home sales, while November saw the typical decline in home sales as we start heading into the winter months. December home sales for Gilbert were almost exactly the same as November. The number of Gilbert homes sold in 2020 ended up higher than the previous 3 years.
2019
Gilbert home sales were once again very similar to the previous two years. It started off a little slower, with 255 sales in January being the lowest in the last 3 years but ended up with 105 more homes sold than in 2018, and 18 more homes sold than in 2017.
Gilbert, AZ Home Inventory:
2023
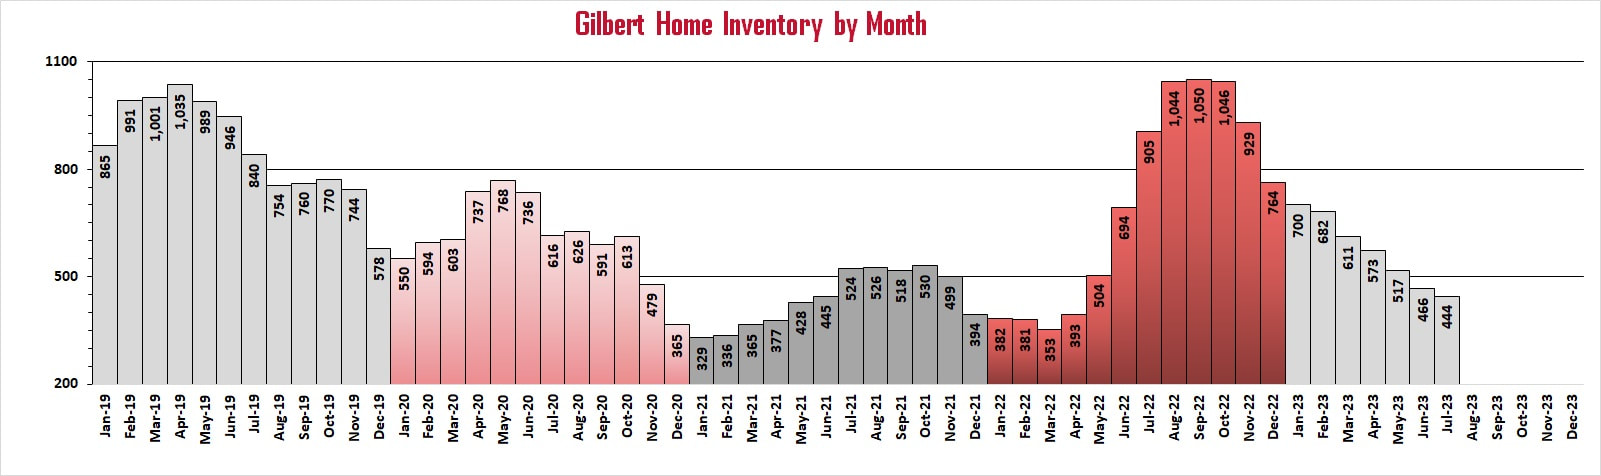
Home inventory continues to decrease as we head into 2023 as fewer people are interested in selling their homes. Gilbert home inventory has dropped for 10 consecutive months.
2022
Gilbert home inventory dropped in January of 2022, but the inventory is higher than it was in January of 2021. This is the third straight January that the inventory of Gilbert homes has decreased to start off a new year. Gilbert home inventory has decreased for five consecutive months, since November of 2021. April through August has seen significant increases in the inventory of Gilbert homes. Inventory has gone from 353 in March to 1,043 in September, almost tripling. October inventory slightly dropped, and November and December saw a more significant decline as fewer homeowners are putting their homes on the market to end 2022.
2021
The home inventory in Gilbert started at an all-time low of 329 to start off 2021. It dropped a little from December and is 40.2% lower than January of last year. Inventory, or lack thereof, remains a large issue, as there just aren't enough Gilbert homes being listed for sale to keep up with demand from home buyers. The inventory of Gilbert homes for sale did increase in February through July but remains lower than the previous three years. August inventory remained the same as July, and then decreased in September for the first time all year. Gilbert home inventory increased again in October but saw a decline in November and December to end 2021. Gilbert home inventory is 34.8% lower this month than in November of 2019 (not using 2020 numbers due to COVID-19 pandemic).
2018-20
The inventory of homes for sale in Gilbert had a steady increase from January 2018 through June of 2018, and then gradually declined to 862 to end the year. The inventory of Gilbert homes started increasing in 2019 and reached a new all-time high of 1035 in April of 2019. The overall inventory of Gilbert homes remained above 700 for all of 2018 and almost all of 2019, but in December the inventory dropped below 700 to 578. Coronavirus hit early in 2020, and that saw the inventory of Gilbert homes increase in April and May, as home sales temporary halted. Starting in June, when the housing market began to open up again, the inventory of Gilbert homes began to decline almost every month, until reaching an all-time low of 365 in December of 2020.
While the average number of Gilbert homes sold in the last 6 months increasing to 288, and home inventory decreasing from 466 to 444, this leaves a decreasing absorption rate of 1.54 months, which is still reflecting a sellers' market, as anything below 6.0 is considered a seller's market.
How inventory affects home prices:
When the inventory of homes in Gilbert increases, the economics of supply and demand will take effect. When there is a large inventory of homes available for sale in Gilbert, home prices will decrease in value for a couple of reasons. One reason is because there are more homes for Gilbert home buyers to choose from. Buyers will take their time in selecting a home, causing homes to stay on the market longer and increasing inventory. Because there are more Gilbert homes for sale, home sellers will begin to lower their sales price in order to get their home sold.
When the inventory of homes in Gilbert decreases, you will start to see an increase in home prices. With a low inventory of homes, Gilbert home sellers know that they can ask a higher price because there are more buyers in the market than homes for sale. Homes tend to sell faster, and for more money when inventory is low. There are fewer choices for Gilbert home buyers, and sometimes you will have to offer a higher than list price to get the home you want.
When the inventory of homes in Gilbert decreases, you will start to see an increase in home prices. With a low inventory of homes, Gilbert home sellers know that they can ask a higher price because there are more buyers in the market than homes for sale. Homes tend to sell faster, and for more money when inventory is low. There are fewer choices for Gilbert home buyers, and sometimes you will have to offer a higher than list price to get the home you want.
Gilbert Days On Market:
Click image below to enlarge!
2023
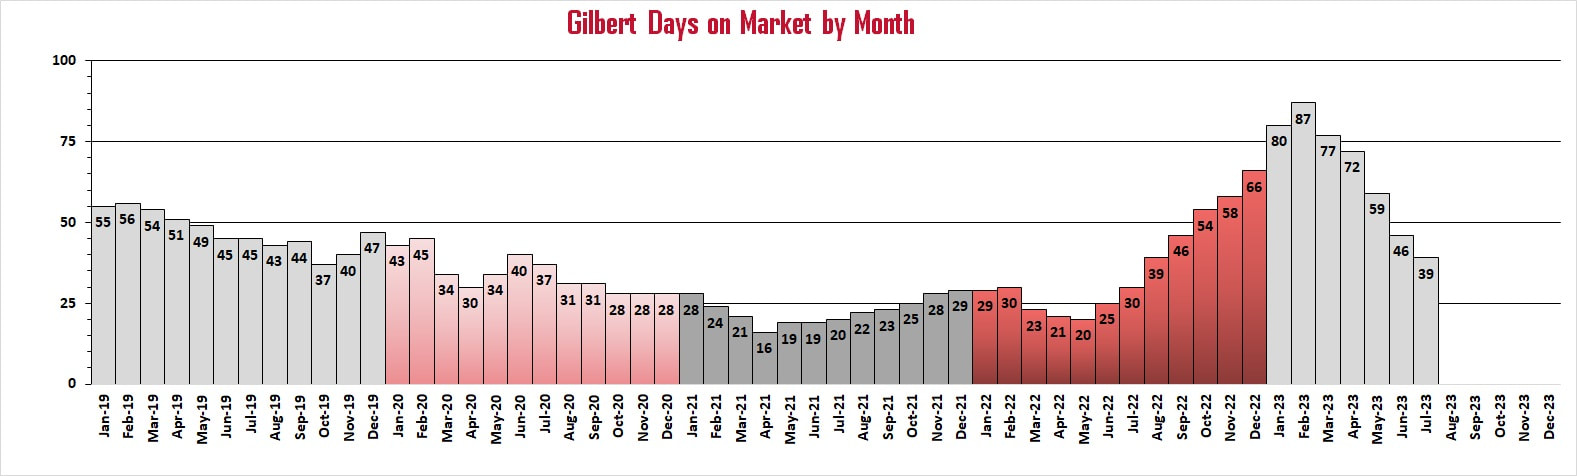
The days on market for homes in Gilbert shot up to start 2023 to a new high of 87. After increasing for 9 straight months, it finally saw a decrease in March and has continued to decrease each month since then.
2022
The Gilbert days on market remained the same in January as it was in December of 2021, at 29 DOM. The DOM has gradually climbed up over the last 10 months, from the all-time low of 16 DOM that was recorded in April of 2021, to 30 DOM in February. March, April, and May have seen a decrease in DOM down to 20. June through December have seen an increase in the Gilbert DOM from 20 up to 66 DOM. This has been a fairly steep increase, as the DOM in Gilbert has more than tripled in the last 7 months and is now the highest it has been over the last 4 years.
2021
The days on market in Gilbert remained at 28 for the last 3 months of 2020, as well as for January as we headed into the new year. As long as the inventory of homes for sale remains low, and buyer demand is high, homes in Gilbert will continue to sell very fast. The DOM dropped for the third consecutive month and reached a new record-low at 16 in April of this year. After reaching a record low, May and June have seen a slight increase back up to 19 DOM. July through December has seen small increases for six consecutive months, bringing Gilbert DOM up to 30 (which is still extremely low).
2017-20
As you can see by the graph, Days on Market for Gilbert has had a very U-shaped curve each year, which shows the DOM has been higher at the beginning of each year, decreasing through the spring and summer months, and then increasing again at the end of each year. However, Gilbert DOM decreased from an average of 55 to 47 DOM between 2017 and 2018. In 2019, the numbers were almost exactly the same as in 2018. In 2020, the Gilbert DOM started off lower than it ever has in January, at 43. It ticked slightly up to 45 in February, but then dropped to low of 30 DOM in April. With Coronavirus hitting the US Housing market in mid-March and shutting down our economy, it doesn't look as though it has affected the DOM for Gilbert. We will have to see if DOM will increase in the coming months, or if it can withstand the economic shutdown long-term, as over 40 million people have lost their jobs, and many businesses have been closed by the government due to the pandemic. May did see a slight uptick to 34 DOM, back to the average it was in March this year, and June increased up to 39 DOM. July through September has seen a steady decline to 31 DOM. October through December remained steady at an all-time low of 28 DOM. Gilbert homes are selling faster in 2020 than they ever have, or at least since the housing bubble back in 2006-2007.
Days on market (DOM) is a measure of the age of a real estate listing. It is the total number of days a listing is on the active market before an offer is accepted on the property, or an agreement between the real estate broker and home seller ends. The higher the days on market, the longer it is taking for homeowners to sell their Tempe home. The lower the days on market, the faster a Gilbert home is receiving a purchase contract and getting off the market.
Generally, properties with a longer DOM will command lower prices than properties with a shorter DOM because a perception exists that the property may be overpriced or less desirable the longer it remains on the market. DOM often factors into developing a pricing strategy. DOM can also be used to gauge the condition, or trend of the housing market. Previous history has shown that a fairly stable real estate market in Gilbert should have average days on the market somewhere between 60 and 90 days.
Generally, properties with a longer DOM will command lower prices than properties with a shorter DOM because a perception exists that the property may be overpriced or less desirable the longer it remains on the market. DOM often factors into developing a pricing strategy. DOM can also be used to gauge the condition, or trend of the housing market. Previous history has shown that a fairly stable real estate market in Gilbert should have average days on the market somewhere between 60 and 90 days.
Gilbert New Listings by Month:
Click image below to enlarge!
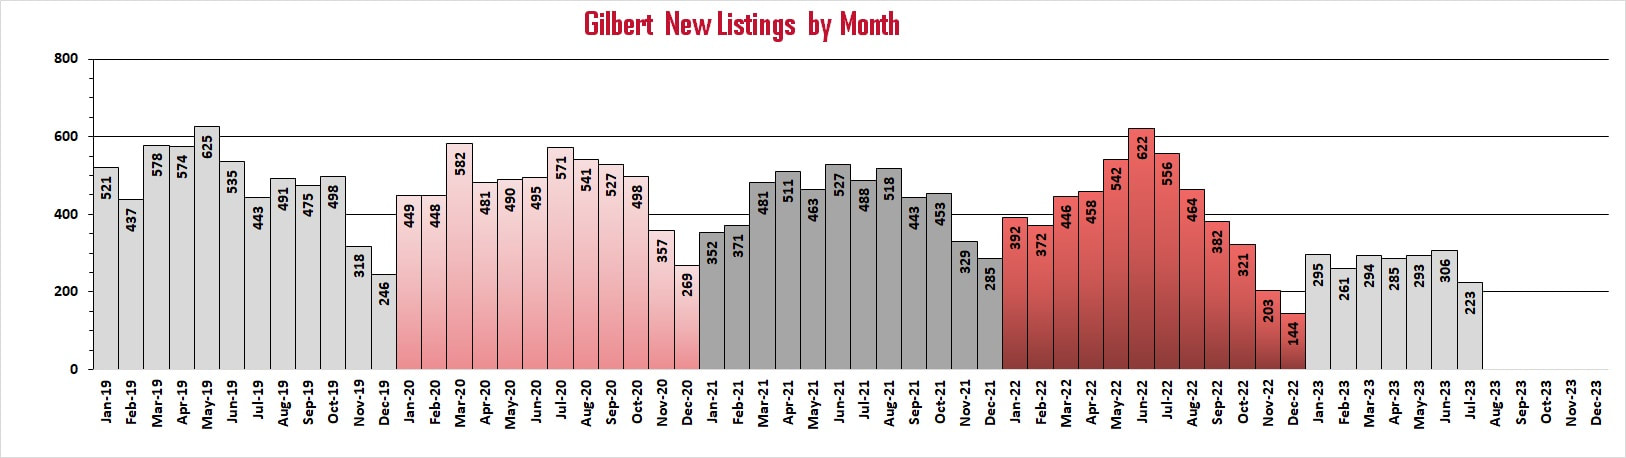
2023
New Gilbert listings shot up in January to start 2023, but the number of new listings is lower than the new January listings in the last 4 years. New monthly listings in Gilbert have remained consistent through June and dropped in July.
2022
New listings in Gilbert saw a nice increase in January to start off 2022 on a good note. It is typical for new listings to increase in January, but the number of new listings this January is larger than it was in January of 2021. February saw a decrease in new Gilbert listings, while March through June have increased. New listings in Gilbert are now the highest they have been since May of 2019. July saw the first decrease in new Gilbert listings since February, followed by six additional decreases through the end of the year.
2021
The number of new listings in Gilbert to start 2021 was much lower than in the previous two years, a decrease of 27.8% from January of 2020. If new listings remain low, and demand remains high, home prices will continue to increase in Gilbert. There was a slight increase in new listings for February, but not enough to affect the lack of homes for sale and the high demand. March saw a nice increase in the number of new Gilbert listings, and April saw another small increase, surpassing the number of listings in April of 2020 (which 2020 was low due to the COVID-19 pandemic). May saw a decrease in new Gilbert listings whereas in previous years May would have shown the highest number of new listings for the year. June bounced back with an increase in new Gilbert listings, almost to the same number as last year, but significantly less than in previous years. July saw another drop-off in new Gilbert listings. August saw an uptick in new Gilbert listings, which is not unusual for this month, as August may be homeowners' last-ditch effort to get their home sold before Fall. I would anticipate the number of new listings should decline the remainder of 2021. Just as predicted, the number of new listings in September dropped by almost 80, then remained the same for October. November and December both saw declines to end 2021.
2020
The number of new Gilbert listings by month started off a little low in January and February of 2020, then had a nice increase in March, even though the Coronavirus hit the US Housing market and shut down our economy in mid-March. We will have to see if this trend continues, as over 40 million people have lost their jobs, and many businesses have been shut down by the government due to the pandemic. As you can see, new listings in April decreased quite a bit, with May and June slightly increasing. July jumped up to 571 new listings in Gilbert, which was the highest for July in the last 3 years. August through October has seen a decrease in the number of new listings, and November as well as December saw even larger decreases, which is typical for this time of year. Listings tend to fall off starting in July and really decrease in November as we head into the winter months.
2019
The number new Gilbert listings in 2019 decreased overall from 2018 by 191, even though January saw a high of new listings for that month of 521. The total number of new listings really dropped off in November and December.
Check Out Our Housing Reports in Other East Valley Cities:


"Real Estate is not just a job for me, it's about making a difference in the lives of others"
Troy Erickson Realtor - Representing Buyers, Sellers, and Investors in the Phoenix East Valley:
Chandler, Sun Lakes, Ocotillo, Ahwatukee, Gilbert, Tempe, Mesa, Queen Creek, San Tan Valley, Scottsdale, Phoenix, and more!
Chandler, Sun Lakes, Ocotillo, Ahwatukee, Gilbert, Tempe, Mesa, Queen Creek, San Tan Valley, Scottsdale, Phoenix, and more!